Duke Energy 2012 Annual Report Download - page 69
Download and view the complete annual report
Please find page 69 of the 2012 Duke Energy annual report below. You can navigate through the pages in the report by either clicking on the pages listed below, or by using the keyword search tool below to find specific information within the annual report.-
 1
1 -
2
-
3
-
4
-
5
-
6
-
7
-
8
-
9
-
10
-
11
-
12
-
13
-
14
-
15
-
16
-
17
-
18
-
19
-
20
-
21
-
22
-
23
-
24
-
25
-
26
-
27
-
28
-
29
-
30
-
31
-
32
-
33
-
34
-
35
-
36
-
37
-
38
-
39
-
40
-
41
-
42
-
43
-
44
-
45
-
46
-
47
-
48
-
49
-
50
-
51
-
52
-
53
-
54
-
55
-
56
-
57
-
58
-
 59
59 -
 60
60 -
 61
61 -
 62
62 -
 63
63 -
 64
64 -
 65
65 -
 66
66 -
 67
67 -
 68
68 -
 69
69 -
 70
70 -
 71
71 -
 72
72 -
 73
73 -
 74
74 -
 75
75 -
 76
76 -
 77
77 -
 78
78 -
 79
79 -
80
-
81
-
82
-
83
-
84
-
85
-
86
-
87
-
88
-
89
-
90
-
91
-
92
-
93
-
94
-
95
-
96
-
97
-
98
-
99
-
100
-
101
-
102
-
103
-
104
-
105
-
106
-
107
-
108
-
109
-
110
-
111
-
112
-
113
-
114
-
115
-
116
-
117
-
118
-
119
-
120
-
121
-
122
-
123
-
124
-
125
-
126
-
127
-
128
-
129
-
130
-
131
-
132
-
133
-
134
-
135
-
136
-
137
-
138
-
139
-
140
-
141
-
142
-
143
-
144
-
145
-
146
-
147
-
148
-
149
-
150
-
151
-
152
-
153
-
154
-
155
-
156
-
157
-
158
-
159
-
160
-
161
-
162
-
163
-
164
-
165
-
166
-
167
-
168
-
169
-
170
-
171
-
172
-
173
-
174
-
175
-
176
-
177
-
178
-
179
-
180
-
181
-
182
-
183
-
184
-
185
-
186
-
187
-
188
-
189
-
190
-
191
-
192
-
193
-
194
-
195
-
196
-
197
-
198
-
199
-
200
-
201
-
202
-
203
-
204
-
205
-
206
-
207
-
208
-
209
-
210
-
211
-
212
-
213
-
214
-
215
-
216
-
217
-
218
-
219
-
220
-
221
-
222
-
223
-
224
-
225
-
226
-
227
-
228
-
229
-
230
-
231
-
232
-
233
-
234
-
235
-
236
-
237
-
238
-
239
-
240
-
241
-
242
-
243
-
244
-
245
-
246
-
247
-
248
-
249
-
250
-
251
-
252
-
253
-
254
-
255
-
256
-
257
-
258
-
259
-
260
-
261
-
262
-
263
-
264
-
265
-
266
-
267
-
268
-
269
-
270
-
271
-
272
-
273
-
274
-
275
-
276
-
277
-
278
-
279
-
280
-
281
-
282
-
283
-
284
-
285
-
286
-
287
-
288
-
289
-
290
-
291
-
292
-
293
-
294
-
295
-
296
-
297
-
298
-
299
-
300
-
301
-
302
-
303
-
304
-
305
-
306
-
307
-
308
 |
 |

49
PART II
DUKE ENERGY OHIO
INTRODUCTION
Management’s Discussion and Analysis should be read in conjunction
with the accompanying Consolidated Financial Statements and Notes for the
years ended December 31, 2012, 2011, and 2010.
BASIS OF PRESENTATION
The results of operations and variance discussion for Duke Energy Ohio is
presented in a reduced disclosure format in accordance with General Instruction
(I)(2)(a) of Form 10-K.
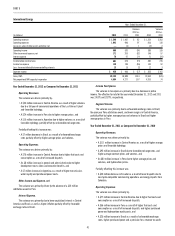
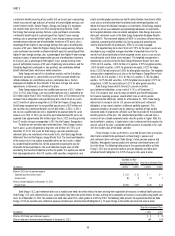
RESULTS OF OPERATIONS
Years Ended December 31,
(in millions) 2012 2011 Variance
Operating revenues $3,152 $3,181 $(29)
Operating expenses 2,810 2,811 (1)
Gains on sales of other assets and other, net 752
Operating income 349 375 (26)
Other income and expense, net 13 19 (6)
Interest expense 89 104 (15)
Income before income taxes 273 290 (17)
Income tax expense 98 96 2
Net income $ 175 $ 194 $(19)
The following table shows the percent changes in Franchised Electric and Gas’s GWh sales and average number of customers for Duke Energy Ohio. Except as
otherwise noted, the below percentages represent billed sales only for the periods presented and are not weather normalized.
Increase (decrease) over prior year 2012 2011
Residential sales(a) (3.3)% (3.2)%
General service sales(a) (2.6)% (1.2)%
Industrial sales(a) 0.6 % (2.9)%
Wholesale power sales (35.9)% 15.9 %
Total sales(b) (2.3)% (2.3)%
Average number of customers 0.5 % 0.2 %
(a) Major components of retail sales.
(b) Consists of all components of sales, including all billed and unbilled retail sales, and wholesale sales to incorporated municipalities and to public and private utilities and power marketers.
The decrease in Duke Energy Ohio’s net income for the year ended
December 31, 2012 compared to December 31, 2011 was primarily due to the
following factors:
Operating Revenues.
The variance was primarily driven by:
• A $285 million decrease in electric revenues from the coal-fi red generation
assets driven primarily by the expiration of the 2009-2011 ESP, net of
stability charge revenues, partially offset by the coal-fi red generation assets
participating in the PJM wholesale energy market in 2012,
• A $39 million decrease in electric revenues from the gas-fi red
generation assets driven primarily by lower power prices, partially offset
by increased volumes, and
• An $18 million decrease in PJM capacity revenues related to lower
average cleared capacity auction pricing in 2012 compared to 2011 for
the gas-fi red generation assets, net of an increase associated with the
move of the coal-fi red assets from MISO to PJM in 2012.
Partially offsetting these decreases were:
• A $279 million increase in regulated fuel and purchased power revenues
driven primarily by higher purchased power revenues collected under
the new Ohio ESP which became effective January 1, 2012, partially
offset by reduced gas sales volumes and lower natural gas costs, and
• A $32 million increase in retail Ohio electric energy effi ciency rider
revenue resulting primarily from the approval of the fi nal save-a-watt
order for the years 2009-2012.
Operating Expenses.
The variance was primarily driven by:
• A $101 million decrease in operating and maintenance expenses
resulting primarily from prior year recognition of MISO exit fees, higher
prior year station outages, and regulatory asset amortization expenses,
• An $88 million decrease primarily from the 2011 impairment of excess
emission allowances as a result of the EPA’s issuance of the Cross-State
Air Pollution Rule (CSAPR), and
• An $85 million decrease in fuel expense from the gas-fi red generation
assets driven by lower natural gas costs, partially offset by higher volumes.
Partially offsetting these decreases was:
• A $274 million increase in regulated fuel expense driven primarily by
higher purchased power expense as a result of the new ESP, partially
offset by reduced gas sales volumes and lower natural gas costs.
Interest Expense.
The variance was primarily due to lower average debt balances in 2012
compared to 2011 and post in-service carrying charges related to new projects.