Duke Energy 2012 Annual Report Download - page 58
Download and view the complete annual report
Please find page 58 of the 2012 Duke Energy annual report below. You can navigate through the pages in the report by either clicking on the pages listed below, or by using the keyword search tool below to find specific information within the annual report.-
 1
1 -
2
-
3
-
4
-
5
-
6
-
7
-
8
-
9
-
10
-
11
-
12
-
13
-
14
-
15
-
16
-
17
-
18
-
19
-
20
-
21
-
22
-
23
-
24
-
25
-
26
-
27
-
28
-
29
-
30
-
31
-
32
-
33
-
34
-
35
-
36
-
37
-
38
-
39
-
40
-
41
-
42
-
43
-
44
-
45
-
46
-
47
-
 48
48 -
 49
49 -
 50
50 -
 51
51 -
 52
52 -
 53
53 -
 54
54 -
 55
55 -
 56
56 -
 57
57 -
 58
58 -
 59
59 -
 60
60 -
 61
61 -
 62
62 -
 63
63 -
 64
64 -
 65
65 -
 66
66 -
 67
67 -
 68
68 -
69
-
70
-
71
-
72
-
73
-
74
-
75
-
76
-
77
-
78
-
79
-
80
-
81
-
82
-
83
-
84
-
85
-
86
-
87
-
88
-
89
-
90
-
91
-
92
-
93
-
94
-
95
-
96
-
97
-
98
-
99
-
100
-
101
-
102
-
103
-
104
-
105
-
106
-
107
-
108
-
109
-
110
-
111
-
112
-
113
-
114
-
115
-
116
-
117
-
118
-
119
-
120
-
121
-
122
-
123
-
124
-
125
-
126
-
127
-
128
-
129
-
130
-
131
-
132
-
133
-
134
-
135
-
136
-
137
-
138
-
139
-
140
-
141
-
142
-
143
-
144
-
145
-
146
-
147
-
148
-
149
-
150
-
151
-
152
-
153
-
154
-
155
-
156
-
157
-
158
-
159
-
160
-
161
-
162
-
163
-
164
-
165
-
166
-
167
-
168
-
169
-
170
-
171
-
172
-
173
-
174
-
175
-
176
-
177
-
178
-
179
-
180
-
181
-
182
-
183
-
184
-
185
-
186
-
187
-
188
-
189
-
190
-
191
-
192
-
193
-
194
-
195
-
196
-
197
-
198
-
199
-
200
-
201
-
202
-
203
-
204
-
205
-
206
-
207
-
208
-
209
-
210
-
211
-
212
-
213
-
214
-
215
-
216
-
217
-
218
-
219
-
220
-
221
-
222
-
223
-
224
-
225
-
226
-
227
-
228
-
229
-
230
-
231
-
232
-
233
-
234
-
235
-
236
-
237
-
238
-
239
-
240
-
241
-
242
-
243
-
244
-
245
-
246
-
247
-
248
-
249
-
250
-
251
-
252
-
253
-
254
-
255
-
256
-
257
-
258
-
259
-
260
-
261
-
262
-
263
-
264
-
265
-
266
-
267
-
268
-
269
-
270
-
271
-
272
-
273
-
274
-
275
-
276
-
277
-
278
-
279
-
280
-
281
-
282
-
283
-
284
-
285
-
286
-
287
-
288
-
289
-
290
-
291
-
292
-
293
-
294
-
295
-
296
-
297
-
298
-
299
-
300
-
301
-
302
-
303
-
304
-
305
-
306
-
307
-
308
 |
 |

38
PART II
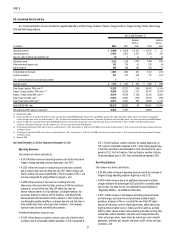
• A $105 million increase in depreciation and amortization primarily due
to increases in depreciation as a result of additional plant in service
and amortization of regulatory assets.
Partially offsetting these increases was:
• A $99 million decrease in operating and maintenance expense primarily
due to the establishment of regulatory assets in the fi rst quarter of
2012, pursuant to regulatory orders, for future recovery of certain
employee severance costs related to the 2010 voluntary severance plan
and other costs, and lower storm costs, partially offset by increased
costs associated with the energy effi ciency programs.
Other Income and Expense, net.
The variance was driven primarily by the inclusion of Progress Energy
other income and expenses beginning in July 2012.
Interest Expense.
The variance was primarily driven by the inclusion of Progress Energy
interest expense beginning in July 2012.
Income Tax Expense.
The variance is primarily due to an increase in pretax income. The
effective tax rate for the years ended December 31, 2012 and 2011 was 35.0%
and 36.3%, respectively.
Segment Income.
The variance resulted primarily from the inclusion of Progress Energy
results beginning in July 2012, higher net retail pricing and rate riders and
decreased operating and maintenance expenses. These positive impacts were
partially offset by the additional impairment and other charges related to the
Edwardsport IGCC plant, unfavorable weather, and increased depreciation and
amortization.
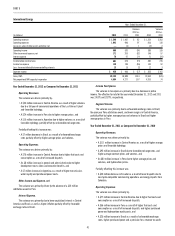
Year Ended December 31, 2011 as Compared to December 31, 2010
Operating Revenues.
The variance was driven primarily by:
• A $230 million increase in rate riders and retail rates primarily due
to the 2011 implementation of the North Carolina construction work
in progress (CWIP) rider, the save-a-watt (SAW) and demand side
management programs, and the rider for the Edwardsport IGCC plant,
• A $22 million increase in fuel revenues (including emission allowances)
driven primarily by higher fuel rates for electric retail customers in all
jurisdictions, and higher purchased power costs in Indiana, partially
offset by decreased demand from electric retail customers in 2011
compared to the same period in 2010 mainly due to less favorable
weather conditions, lower demand and fuel rates in Ohio and Kentucky
from natural gas retail customers. Fuel revenues represent sales to
retail and wholesale customers, and
• An $18 million net increase in wholesale power revenues, net of
sharing, primarily due to additional volumes and charges for capacity
for customers served under long-term contracts.
Partially offsetting these increases was:
• A $244 million decrease in GWh and thousand cubic feet (Mcf) sales
to retail customers due to less favorable weather conditions in 2011
compared to the same period in 2010. For the Carolinas, Ohio and
Indiana, weather statistics for both heating degree days and cooling
degree days in 2011 were unfavorable compared to 2010. The year
2010 had the most cooling degree days on record and December 2010
tied with December 1963 for the coldest December on record in the
Duke Energy Carolinas’ service area (dating back to 1961).
Operating Expenses.
The variance was driven primarily by:
• A $204 million increase due to impairment charges, which primarily
relate to an additional impairment charge related to the Edwardsport
IGCC plant that is currently under construction. See Note 4 to the
Consolidated Financial Statements, “Regulatory Matters,” for additional
information, and
• A $110 million increase in operating and maintenance expenses
primarily due to higher non-outage costs at nuclear and fossil
generation stations, higher storm costs, increased scheduled outage
costs at nuclear generation stations, and increased costs related to the
implementation of the SAW program, partially offset by a 2010 litigation
settlement.
Income Tax Expense.
The income tax variance increase is primarily due to an increase in pretax
income. The effective tax rate for each of the years ended December 31, 2011
and 2010 was 36.3%.
Segment Income.
As discussed above, the variance resulted primarily from less favorable
weather, impairment charges, higher operating and maintenance expenses, and
higher income tax expense. These negative impacts were partially offset by overall
net higher retail rates and rate riders and higher wholesale power revenues.
Matters Impacting Future USFE&G Results
On December 27, 2012, the IURC approved a settlement agreement
between Duke Energy Indiana and certain intervenors to cap the construction
costs recoverable in retail rates. The Edwardsport Generating Station
(Edwardsport IGCC) plant is scheduled to begin commercial operation in
mid-2013. USFE&G’s earnings could be adversely impacted by additional delays
in the commencement of operations which may result in increased costs.
USFE&G currently has pending rate cases in North Carolina and Ohio.
USFE&G also plans to fi le rate cases in South Carolina before the end of 2013.
These rate cases are needed to recover the costs of plant modernization and
other capital investments in generation, transmission, and distribution systems,
as well as increased expenditures for nuclear plants and personnel, recovery of
costs associated with MGP sites, vegetation management and other operating
costs. USFE&G’s earnings could be adversely impacted if these rate cases are
denied or delayed by the NCUC, PSCSC or PUCO.
In accordance with the terms of the 2012 FPSC Settlement Agreement, with
consumer representatives and approved by the FPSC, Progress Energy Florida
retains the sole discretion and fl exibility to retire Crystal River Unit 3. As a result
of the decision to retire Crystal River Unit 3, under the terms of the 2012 FPSC
Settlement Agreement, Progress Energy Florida is allowed to recover all remaining
Crystal River Unit 3 investments and to earn a return on the Crystal River Unit 3
investments set at its current authorized overall cost of capital, adjusted to
refl ect a return on equity set at 70 percent of the current FPSC authorized return
on equity, no earlier than the fi rst billing cycle of January 2017. Progress Energy
Florida expects that the FPSC will review the prudence of the retirement decision in
Phase 2 of the Crystal River Unit 3 delamination regulatory docket. Progress Energy
Florida has also asked the FPSC to review the mediated resolution of insurance
claims with NEIL as part of Phase 3 of this regulatory docket. Phase 2 and Phase 3
hearings have been tentatively scheduled to begin on June 19, 2013. USFE&G’s
fi nancial condition and results of operations could be adversely impacted if the
FPSC issues an unfavorable ruling.