Duke Energy 2012 Annual Report Download - page 187
Download and view the complete annual report
Please find page 187 of the 2012 Duke Energy annual report below. You can navigate through the pages in the report by either clicking on the pages listed below, or by using the keyword search tool below to find specific information within the annual report.-
 1
1 -
2
-
3
-
4
-
5
-
6
-
7
-
8
-
9
-
10
-
11
-
12
-
13
-
14
-
15
-
16
-
17
-
18
-
19
-
20
-
21
-
22
-
23
-
24
-
25
-
26
-
27
-
28
-
29
-
30
-
31
-
32
-
33
-
34
-
35
-
36
-
37
-
38
-
39
-
40
-
41
-
42
-
43
-
44
-
45
-
46
-
47
-
48
-
49
-
50
-
51
-
52
-
53
-
54
-
55
-
56
-
57
-
58
-
59
-
60
-
61
-
62
-
63
-
64
-
65
-
66
-
67
-
68
-
69
-
70
-
71
-
72
-
73
-
74
-
75
-
76
-
77
-
78
-
79
-
80
-
81
-
82
-
83
-
84
-
85
-
86
-
87
-
88
-
89
-
90
-
91
-
92
-
93
-
94
-
95
-
96
-
97
-
98
-
99
-
100
-
101
-
102
-
103
-
104
-
105
-
106
-
107
-
108
-
109
-
110
-
111
-
112
-
113
-
114
-
115
-
116
-
117
-
118
-
119
-
120
-
121
-
122
-
123
-
124
-
125
-
126
-
127
-
128
-
129
-
130
-
131
-
132
-
133
-
134
-
135
-
136
-
137
-
138
-
139
-
140
-
141
-
142
-
143
-
144
-
145
-
146
-
147
-
148
-
149
-
150
-
151
-
152
-
153
-
154
-
155
-
156
-
157
-
158
-
159
-
160
-
161
-
162
-
163
-
164
-
165
-
166
-
167
-
168
-
169
-
170
-
171
-
172
-
173
-
174
-
175
-
176
-
 177
177 -
 178
178 -
 179
179 -
 180
180 -
 181
181 -
 182
182 -
 183
183 -
 184
184 -
 185
185 -
 186
186 -
 187
187 -
 188
188 -
 189
189 -
 190
190 -
 191
191 -
 192
192 -
 193
193 -
 194
194 -
 195
195 -
 196
196 -
 197
197 -
198
-
199
-
200
-
201
-
202
-
203
-
204
-
205
-
206
-
207
-
208
-
209
-
210
-
211
-
212
-
213
-
214
-
215
-
216
-
217
-
218
-
219
-
220
-
221
-
222
-
223
-
224
-
225
-
226
-
227
-
228
-
229
-
230
-
231
-
232
-
233
-
234
-
235
-
236
-
237
-
238
-
239
-
240
-
241
-
242
-
243
-
244
-
245
-
246
-
247
-
248
-
249
-
250
-
251
-
252
-
253
-
254
-
255
-
256
-
257
-
258
-
259
-
260
-
261
-
262
-
263
-
264
-
265
-
266
-
267
-
268
-
269
-
270
-
271
-
272
-
273
-
274
-
275
-
276
-
277
-
278
-
279
-
280
-
281
-
282
-
283
-
284
-
285
-
286
-
287
-
288
-
289
-
290
-
291
-
292
-
293
-
294
-
295
-
296
-
297
-
298
-
299
-
300
-
301
-
302
-
303
-
304
-
305
-
306
-
307
-
308
 |
 |

167
PART II
DUKE ENERGY CORPORATION • DUKE ENERGY CAROLINAS, LLC • PROGRESS ENERGY, INC. • CAROLINA POWER & LIGHT COMPANY d/b/a PROGRESS ENERGY
CAROLINAS, INC. • FLORIDA POWER CORPORATION d/b/a PROGRESS ENERY FLORIDA, INC. • DUKE ENERGY OHIO, INC. • DUKE ENERGY INDIANA, INC
.
Combined Notes to Consolidated Financial Statements – (Continued)
• Potentially more stringent environmental regulations from the
U.S. EPA — In May and July of 2010, the EPA issued proposed rules
associated with the regulation of CCRs to address risks from the
disposal of CCRs (e.g., ash ponds) and to limit the interstate transport
of emissions of NOx and SO2. These proposed regulations, along with
other pending EPA regulations, could result in signifi cant expenditures
for coal fi red generation plants, and could result in the early retirement
of certain generation assets, which do not currently have control
equipment for NOx and SO2, as soon as 2014.
• Customer switching — ESP customers have increasingly selected
alternative generation service providers, as allowed by Ohio legislation,
which further erodes margins on sales. In the second quarter of 2010,
Duke Energy Ohio’s residential class became the target of an intense
marketing campaign offering signifi cant discounts to residential
customers that switch to alternate power suppliers. Customer switching
levels were at approximately 55% at June 30, 2010 compared to
approximately 29% in the third quarter of 2009.
As a result of the factors above, a non-cash goodwill impairment charge
of $500 million was recorded during the second quarter of 2010. This impairment
charge represented the entire remaining goodwill balance for Commercial Power’s
non regulated Midwest generation reporting unit. In addition to the goodwill
impairment charge, and as a result of factors similar to those described above,
Commercial Power recorded $160 million of pre-tax impairment charges related
to certain generating assets and emission allowances primarily associated with
these generation assets in the Midwest to write-down the value of these assets
to their estimated fair value. The generation assets that were subject to this
impairment charge were those coal-fi red generating assets that do not have
certain environmental emissions control equipment, causing these generation
assets to be heavily impacted by the EPA’s proposed rules on emissions of
NOx and SO2. These impairment charges are recorded in Goodwill and Other
Impairment Charges on Duke Energy’s Consolidated Statement of Operations.
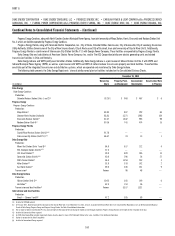
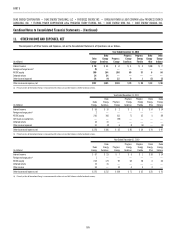
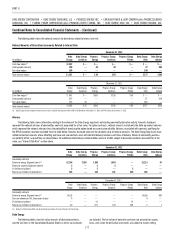
Intangible Assets
The following tables show the carrying amount and accumulated
amortization of intangible assets.
December 31, 2012
(in millions) Duke Energy
Duke Energy
Ohio
Duke Energy
Indiana
Emission allowances $ 80 $ 24 $ 29
Gas, coal and power contracts 295 272 24
Wind development rights 111 — —
Other 109 10 —
Total gross carrying amounts 595 306 53
Accumulated amortization —
gas, coal and power contracts (180) (168) (12)
Accumulated amortization —
wind development rights (9) — —
Accumulated amortization — other (34) (9) —
Total accumulated amortization (223) (177) (12)
Total intangible assets, net $ 372 $ 129 $ 41
December 31, 2011
(in millions) Duke Energy
Duke Energy
Ohio
Duke Energy
Indiana
Emission allowances $ 66 $ 29 $ 37
Gas, coal and power contracts 295 271 24
Wind development rights 137 — —
Other 72 10 —
Total gross carrying amounts 570 310 61
Accumulated amortization —
gas, coal and power contracts (169) (158) (11)
Accumulated amortization —
wind development rights (7) — —
Accumulated amortization — other (31) (9) —
Total accumulated amortization (207) (167) (11)
Total intangible assets, net $ 363 $ 143 $ 50
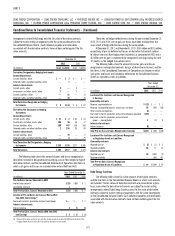
Emission allowances in the tables above for Duke Energy and Duke
Energy Ohio include emission allowances acquired by Duke Energy as part of its
merger with Cinergy, which were recorded at the then fair value on the date of
the merger in April 2006, and emission allowances purchased by Duke Energy
Ohio. Additionally, the Duke Energy Registrants are allocated certain zero cost
emission allowances on an annual basis.
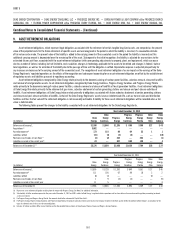
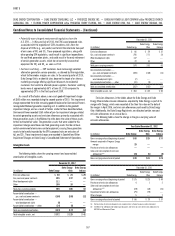
The following tables show the change in the gross carrying value of
emission allowances.
Year Ended December 31, 2012
(in millions) Duke Energy
Duke Energy
Ohio
Duke Energy
Indiana
Gross carrying value at beginning of period $ 66 $ 29 $ 37
Amounts acquired in Progress Energy
merger 29 —
Purchases of emission allowances —— —
Sales and consumption of emission
allowances(a)(b) (15) (5) (8)
Gross carrying value at end of period $ 80 $ 24 $ 29
December 31, 2011
(in millions) Duke Energy
Duke Energy
Ohio
Duke Energy
Indiana
Gross carrying value at beginning of period $175 $125 $ 49
Purchases of emission allowances 4 1 2
Sales and consumption of emission
allowances(a)(b) (39) (18) (21)
Impairment of emission allowances (79) (79) —
Other changes 5 — 7
Gross carrying value at end of period $ 66 $ 29 $ 37
(a) Carrying value of emission allowances are recognized via a charge to expense when consumed.
(b) See Note 2 for additional information regarding gains and losses on sales of emission allowances by
USFE&G and Commercial Power.