Duke Energy 2012 Annual Report Download - page 65
Download and view the complete annual report
Please find page 65 of the 2012 Duke Energy annual report below. You can navigate through the pages in the report by either clicking on the pages listed below, or by using the keyword search tool below to find specific information within the annual report.-
 1
1 -
2
-
3
-
4
-
5
-
6
-
7
-
8
-
9
-
10
-
11
-
12
-
13
-
14
-
15
-
16
-
17
-
18
-
19
-
20
-
21
-
22
-
23
-
24
-
25
-
26
-
27
-
28
-
29
-
30
-
31
-
32
-
33
-
34
-
35
-
36
-
37
-
38
-
39
-
40
-
41
-
42
-
43
-
44
-
45
-
46
-
47
-
48
-
49
-
50
-
51
-
52
-
53
-
54
-
 55
55 -
 56
56 -
 57
57 -
 58
58 -
 59
59 -
 60
60 -
 61
61 -
 62
62 -
 63
63 -
 64
64 -
 65
65 -
 66
66 -
 67
67 -
 68
68 -
 69
69 -
 70
70 -
 71
71 -
 72
72 -
 73
73 -
 74
74 -
 75
75 -
76
-
77
-
78
-
79
-
80
-
81
-
82
-
83
-
84
-
85
-
86
-
87
-
88
-
89
-
90
-
91
-
92
-
93
-
94
-
95
-
96
-
97
-
98
-
99
-
100
-
101
-
102
-
103
-
104
-
105
-
106
-
107
-
108
-
109
-
110
-
111
-
112
-
113
-
114
-
115
-
116
-
117
-
118
-
119
-
120
-
121
-
122
-
123
-
124
-
125
-
126
-
127
-
128
-
129
-
130
-
131
-
132
-
133
-
134
-
135
-
136
-
137
-
138
-
139
-
140
-
141
-
142
-
143
-
144
-
145
-
146
-
147
-
148
-
149
-
150
-
151
-
152
-
153
-
154
-
155
-
156
-
157
-
158
-
159
-
160
-
161
-
162
-
163
-
164
-
165
-
166
-
167
-
168
-
169
-
170
-
171
-
172
-
173
-
174
-
175
-
176
-
177
-
178
-
179
-
180
-
181
-
182
-
183
-
184
-
185
-
186
-
187
-
188
-
189
-
190
-
191
-
192
-
193
-
194
-
195
-
196
-
197
-
198
-
199
-
200
-
201
-
202
-
203
-
204
-
205
-
206
-
207
-
208
-
209
-
210
-
211
-
212
-
213
-
214
-
215
-
216
-
217
-
218
-
219
-
220
-
221
-
222
-
223
-
224
-
225
-
226
-
227
-
228
-
229
-
230
-
231
-
232
-
233
-
234
-
235
-
236
-
237
-
238
-
239
-
240
-
241
-
242
-
243
-
244
-
245
-
246
-
247
-
248
-
249
-
250
-
251
-
252
-
253
-
254
-
255
-
256
-
257
-
258
-
259
-
260
-
261
-
262
-
263
-
264
-
265
-
266
-
267
-
268
-
269
-
270
-
271
-
272
-
273
-
274
-
275
-
276
-
277
-
278
-
279
-
280
-
281
-
282
-
283
-
284
-
285
-
286
-
287
-
288
-
289
-
290
-
291
-
292
-
293
-
294
-
295
-
296
-
297
-
298
-
299
-
300
-
301
-
302
-
303
-
304
-
305
-
306
-
307
-
308
 |
 |

45
PART II
PROGRESS ENERGY
INTRODUCTION
Management’s Discussion and Analysis should be read in conjunction
with the accompanying Consolidated Financial Statements and Notes for the
years ended December 31, 2012, 2011, and 2010.
BASIS OF PRESENTATION
The results of operations and variance discussion for Progress Energy is
presented in a reduced disclosure format in accordance with General Instruction
(I)(2)(a) of Form 10-K.
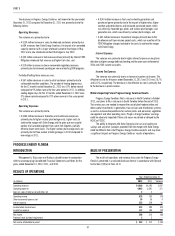
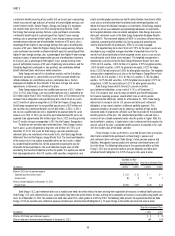
RESULTS OF OPERATIONS
Years Ended December 31,
(in millions) 2012 2011 Variance
Operating revenues $9,405 $8,948 $ 457
Operating expenses 8,266 7,369 897
(Losses) gains on sales of other assets and other, net (2) 4 (6)
Operating income 1,137 1,583 (446)
Other income and expense, net 130 52 78
Interest expense 740 725 15
Income before income taxes 527 910 (383)
Income tax expense 172 323 (151)
Income from continuing operations 355 587 (232)
Discontinued operations, net of tax 52 (5) 57
Net income 407 582 (175)
Less: Net income attributable to noncontrolling interests 77—
Net income attributable to parent $ 400 $ 575 $ (175)
The decrease in Progress Energy’s net income for the year ended
December 31, 2012 compared to December 31, 2011 was primarily due to the
following factors:
Operating Revenues.
The variance was primarily due to:
• A $319 million increase in fuel and capacity revenues driven primarily
by the 2011 charge of $288 million for the amount to be refunded
through the fuel clause in accordance with the 2012 settlement
agreement at Progress Energy Florida, and
• A $154 million increase in sales to wholesale customers primarily due
to Progress Energy Carolinas’ joint dispatch agreement (JDA) revenues
from Duke Energy Carolinas, the impact of an amended capacity
contract with a major wholesale customer at Progress Energy Carolinas
that began in May 2012 and a new wholesale contract at Progress
Energy Carolinas that began in July 2012.
Partially offsetting these increases was:
• An $86 million decrease in sales to retail customers primarily due to
unfavorable weather conditions. The weather statistics for heating
degree days in 2012 were unfavorable compared to the same period
in 2011, while weather statistics for cooling degree days were less
favorable in 2012 compared to the same period in 2011.
Operating Expenses.
The variance was primarily due to:
• A $385 million increase in Operation, maintenance and other expense
primarily due to higher costs to achieve the merger with Duke Energy
and Progress Energy Carolinas’ higher nuclear plant outage costs, and
• A $261 million increase in Fuel used in electric generation and
purchased power primarily due to the impact of establishing a
$100 million regulatory liability for replacement power in accordance
with Progress Energy Florida’s 2012 FPSC settlement agreement
(See Note 4), the impact of higher rates at Progress Energy Carolinas
and a change in generation mix at Progress Energy Carolinas, which
was driven by nuclear refueling outages in 2012.
• A $197 million increase in Impairment charges primarily due to the impact
of the decision to retire Crystal River Unit 3 (See Note 4) and the probable
disallowance of transmission project costs at Progress Energy Carolinas,
which are a portion of the FERC Mitigation charges (See Note 2) included in
the costs to achieve the merger with Duke Energy.
Other Income and Expenses, net.
The variance was primarily due to the $59 million prior-year pretax
unrealized loss to record the change in fair value of the contingent value
obligations (CVOs). The change in fair value was determined by an October 3,
2011 settlement agreement with a CVO holder to purchase all of their CVOs at a
negotiated purchase price. The settlement agreement also led to a subsequent
tender offer to remaining CVO holders at the same purchase price.
Income Tax Expense.
The variance was primarily due to a decrease in pre-tax income. The
effective tax rates for 2012 and 2011 were 32.7% and 35.6%, respectively. The
decrease in the effective tax rate is primarily due to the decrease in pre-tax income
as well as the decrease for the change of fair value of outstanding CVOs.
Discontinued Operations, net of tax.
The variance was primarily due to the impact of the US Global settlement
in 2012 (See Note 5).