Duke Energy 2012 Annual Report Download - page 127
Download and view the complete annual report
Please find page 127 of the 2012 Duke Energy annual report below. You can navigate through the pages in the report by either clicking on the pages listed below, or by using the keyword search tool below to find specific information within the annual report.-
 1
1 -
2
-
3
-
4
-
5
-
6
-
7
-
8
-
9
-
10
-
11
-
12
-
13
-
14
-
15
-
16
-
17
-
18
-
19
-
20
-
21
-
22
-
23
-
24
-
25
-
26
-
27
-
28
-
29
-
30
-
31
-
32
-
33
-
34
-
35
-
36
-
37
-
38
-
39
-
40
-
41
-
42
-
43
-
44
-
45
-
46
-
47
-
48
-
49
-
50
-
51
-
52
-
53
-
54
-
55
-
56
-
57
-
58
-
59
-
60
-
61
-
62
-
63
-
64
-
65
-
66
-
67
-
68
-
69
-
70
-
71
-
72
-
73
-
74
-
75
-
76
-
77
-
78
-
79
-
80
-
81
-
82
-
83
-
84
-
85
-
86
-
87
-
88
-
89
-
90
-
91
-
92
-
93
-
94
-
95
-
96
-
97
-
98
-
99
-
100
-
101
-
102
-
103
-
104
-
105
-
106
-
107
-
108
-
109
-
110
-
111
-
112
-
113
-
114
-
115
-
116
-
 117
117 -
 118
118 -
 119
119 -
 120
120 -
 121
121 -
 122
122 -
 123
123 -
 124
124 -
 125
125 -
 126
126 -
 127
127 -
 128
128 -
 129
129 -
 130
130 -
 131
131 -
 132
132 -
 133
133 -
 134
134 -
 135
135 -
 136
136 -
 137
137 -
138
-
139
-
140
-
141
-
142
-
143
-
144
-
145
-
146
-
147
-
148
-
149
-
150
-
151
-
152
-
153
-
154
-
155
-
156
-
157
-
158
-
159
-
160
-
161
-
162
-
163
-
164
-
165
-
166
-
167
-
168
-
169
-
170
-
171
-
172
-
173
-
174
-
175
-
176
-
177
-
178
-
179
-
180
-
181
-
182
-
183
-
184
-
185
-
186
-
187
-
188
-
189
-
190
-
191
-
192
-
193
-
194
-
195
-
196
-
197
-
198
-
199
-
200
-
201
-
202
-
203
-
204
-
205
-
206
-
207
-
208
-
209
-
210
-
211
-
212
-
213
-
214
-
215
-
216
-
217
-
218
-
219
-
220
-
221
-
222
-
223
-
224
-
225
-
226
-
227
-
228
-
229
-
230
-
231
-
232
-
233
-
234
-
235
-
236
-
237
-
238
-
239
-
240
-
241
-
242
-
243
-
244
-
245
-
246
-
247
-
248
-
249
-
250
-
251
-
252
-
253
-
254
-
255
-
256
-
257
-
258
-
259
-
260
-
261
-
262
-
263
-
264
-
265
-
266
-
267
-
268
-
269
-
270
-
271
-
272
-
273
-
274
-
275
-
276
-
277
-
278
-
279
-
280
-
281
-
282
-
283
-
284
-
285
-
286
-
287
-
288
-
289
-
290
-
291
-
292
-
293
-
294
-
295
-
296
-
297
-
298
-
299
-
300
-
301
-
302
-
303
-
304
-
305
-
306
-
307
-
308
 |
 |

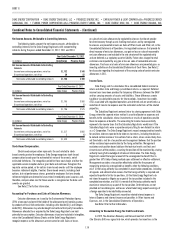
107
PART II
Years Ended December 31,
(in millions) 2012 2011 2010
CASH FLOWS FROM OPERATING ACTIVITIES
Net (loss) income $ (50) $ 168 $ 285
Adjustments to reconcile net (loss) income to net cash provided by operating activities:
Depreciation and amortization 393 395 380
Equity component of AFUDC (84) (88) (56)
Losses on sales of other assets and other, net —— 2
Impairment charges 579 234 44
Deferred income taxes and investment tax credit amortization (74) (63) 143
Contributions to qualifi ed pension plans — (52) (46)
Accrued pension and other post-retirement benefi t costs 15 23 23
(Increase) decrease in
Receivables 625 105
Receivables from affi liated companies 52 63 (204)
Inventory (50) (64) 46
Other current assets (25) 13 (14)
Increase (decrease) in
Accounts payable 18 (14) 39
Accounts payable to affi liated companies (12) 5 (60)
Taxes accrued (27) 29 —
Other current liabilities 6(16) 17
Other assets 647 4
Other liabilities (37) (72) (46)
Net cash provided by operating activities 716 633 662
CASH FLOWS FROM INVESTING ACTIVITIES
Capital expenditures (718) (1,066) (1,255)
Purchases of available-for-sale securities (17) (11) (24)
Proceeds from sales and maturities of available-for-sale securities 18 825
Notes receivable from affi liated companies — 115 (84)
Change in restricted cash — 6 (6)
Other (1) (5) (2)
Net cash used in investing activities (718) (953) (1,346)
CASH FLOWS FROM FINANCING ACTIVITIES
Proceeds from the issuance of long-term debt 250 — 571
Payments for the redemption of long-term debt (7) (14) (199)
Notes payable to affi liated companies (219) 300 —
Capital contribution from parent — — 350
Other (2) (4) (4)
Net cash provided by fi nancing activities 22 282 718
Net increase (decrease) in cash and cash equivalents 20 (38) 34
Cash and cash equivalents at beginning of period 16 54 20
Cash and cash equivalents at end of period $36 $16$54
Supplemental Disclosures
Cash paid for interest, net of amount capitalized $ 130 $ 130 $ 122
Cash paid for income taxes $57 $90$31
Signifi cant non-cash transactions:
Accrued capital expenditures $67 $ 110 $ 131
Transfer of Vermillion Generating Station from Duke Energy Ohio $26 $— $—
See Notes to Consolidated Financial Statements
DUKE ENERGY INDIANA, INC.
Consolidated Statements of Cash Flows