Duke Energy 2012 Annual Report Download - page 250
Download and view the complete annual report
Please find page 250 of the 2012 Duke Energy annual report below. You can navigate through the pages in the report by either clicking on the pages listed below, or by using the keyword search tool below to find specific information within the annual report.-
 1
1 -
2
-
3
-
4
-
5
-
6
-
7
-
8
-
9
-
10
-
11
-
12
-
13
-
14
-
15
-
16
-
17
-
18
-
19
-
20
-
21
-
22
-
23
-
24
-
25
-
26
-
27
-
28
-
29
-
30
-
31
-
32
-
33
-
34
-
35
-
36
-
37
-
38
-
39
-
40
-
41
-
42
-
43
-
44
-
45
-
46
-
47
-
48
-
49
-
50
-
51
-
52
-
53
-
54
-
55
-
56
-
57
-
58
-
59
-
60
-
61
-
62
-
63
-
64
-
65
-
66
-
67
-
68
-
69
-
70
-
71
-
72
-
73
-
74
-
75
-
76
-
77
-
78
-
79
-
80
-
81
-
82
-
83
-
84
-
85
-
86
-
87
-
88
-
89
-
90
-
91
-
92
-
93
-
94
-
95
-
96
-
97
-
98
-
99
-
100
-
101
-
102
-
103
-
104
-
105
-
106
-
107
-
108
-
109
-
110
-
111
-
112
-
113
-
114
-
115
-
116
-
117
-
118
-
119
-
120
-
121
-
122
-
123
-
124
-
125
-
126
-
127
-
128
-
129
-
130
-
131
-
132
-
133
-
134
-
135
-
136
-
137
-
138
-
139
-
140
-
141
-
142
-
143
-
144
-
145
-
146
-
147
-
148
-
149
-
150
-
151
-
152
-
153
-
154
-
155
-
156
-
157
-
158
-
159
-
160
-
161
-
162
-
163
-
164
-
165
-
166
-
167
-
168
-
169
-
170
-
171
-
172
-
173
-
174
-
175
-
176
-
177
-
178
-
179
-
180
-
181
-
182
-
183
-
184
-
185
-
186
-
187
-
188
-
189
-
190
-
191
-
192
-
193
-
194
-
195
-
196
-
197
-
198
-
199
-
200
-
201
-
202
-
203
-
204
-
205
-
206
-
207
-
208
-
209
-
210
-
211
-
212
-
213
-
214
-
215
-
216
-
217
-
218
-
219
-
220
-
221
-
222
-
223
-
224
-
225
-
226
-
227
-
228
-
229
-
230
-
231
-
232
-
233
-
234
-
235
-
236
-
237
-
238
-
239
-
 240
240 -
 241
241 -
 242
242 -
 243
243 -
 244
244 -
 245
245 -
 246
246 -
 247
247 -
 248
248 -
 249
249 -
 250
250 -
 251
251 -
 252
252 -
 253
253 -
 254
254 -
 255
255 -
 256
256 -
 257
257 -
 258
258 -
 259
259 -
 260
260 -
261
-
262
-
263
-
264
-
265
-
266
-
267
-
268
-
269
-
270
-
271
-
272
-
273
-
274
-
275
-
276
-
277
-
278
-
279
-
280
-
281
-
282
-
283
-
284
-
285
-
286
-
287
-
288
-
289
-
290
-
291
-
292
-
293
-
294
-
295
-
296
-
297
-
298
-
299
-
300
-
301
-
302
-
303
-
304
-
305
-
306
-
307
-
308
 |
 |

230
PART II
DUKE ENERGY CORPORATION • DUKE ENERGY CAROLINAS, LLC • PROGRESS ENERGY, INC. • CAROLINA POWER & LIGHT COMPANY d/b/a PROGRESS
ENERGY CAROLINAS, INC. • FLORIDA POWER CORPORATION d/b/a PROGRESS ENERY FLORIDA, INC. • DUKE ENERGY OHIO, INC. • DUKE ENERGY INDIANA, INC.
Combined Notes to Consolidated Financial Statements – (Continued)
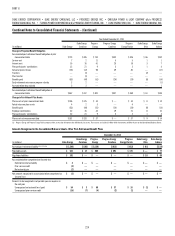
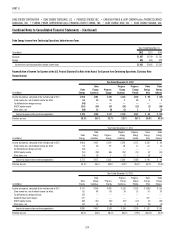
The following tables provide the fair value measurement amounts for the Progress Energy Master Trust qualifi ed pension assets.
Progress Energy
December 31, 2012
(in millions) Total Fair Value(a) Level 1 Level 2 Level 3
Progress Energy Master Trust
Equity securities $1,094 $361 $ 733 $ —
Corporate bonds 432 — 432 —
Partnership interests 154 — — 154
Hedge funds 313 — 189 124
U.S. government securities 515 405 110 —
Other investments 16 — 6 10
Governments bonds - foreign 6 — 6 —
Cash 160 113 47 —
Total assets(b) $2,690 $879 $1,523 $ 288
(a) Excludes $43 million in net payables associated with security purchases and sales.
(b) Progress Energy Carolinas and Progress Energy Florida were allocated approximately 48% and 44% of the Progress Energy Master Trust assets at December 31, 2012, respectively. Accordingly, all Level 1, 2 and 3 amounts
included in the table above are allocable to Progress Energy Carolinas and Progress Energy Florida using these percentages.
December 31, 2011
(in millions) Total Fair Value Level 1 Level 2 Level 3
Progress Energy Master Trust
Equity securities $ 803 $313 $ 490 $ —
Corporate bonds 407 — 407 —
Partnership interests 153 — — 153
Hedge funds 306 — 159 147
U.S. government securities 391 247 144 —
Other investments 16 — 5 11
Cash 115 82 33 —
Total assets(a) $2,191 $642 $1,238 $311
(a) Progress Energy Carolinas and Progress Energy Florida were allocated approximately 50% and 44% of the Progress Energy Master Trust assets at December 31, 2011, respectively. Accordingly, all Level 1, 2 and 3 amounts
included in the table above are allocable to Progress Energy Carolinas and Progress Energy Florida using these percentages.
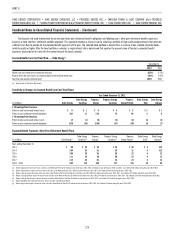
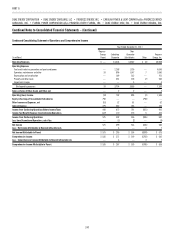
The following tables provide the fair value measurement amounts for VEBA I other post-retirement assets.
December 31, 2012
(in millions) Total Fair Value Level 1 Level 2 Level 3
VEBA I
Cash and cash equivalents $ 22 $ — $22 $—
Equity securities 12 — 12 —
Debt securities 16 — 16 —
Total assets $ 50 $ — $50 $—
December 31, 2011
(in millions) Total Fair Value Level 1 Level 2 Level 3
VEBA I
Cash and cash equivalents $ 26 $ — $26 $—
Equity securities 11 — 11 —
Debt securities 16 — 16 —
Total assets $ 53 $ — $53 $—