Duke Energy 2012 Annual Report Download - page 183
Download and view the complete annual report
Please find page 183 of the 2012 Duke Energy annual report below. You can navigate through the pages in the report by either clicking on the pages listed below, or by using the keyword search tool below to find specific information within the annual report.-
 1
1 -
2
-
3
-
4
-
5
-
6
-
7
-
8
-
9
-
10
-
11
-
12
-
13
-
14
-
15
-
16
-
17
-
18
-
19
-
20
-
21
-
22
-
23
-
24
-
25
-
26
-
27
-
28
-
29
-
30
-
31
-
32
-
33
-
34
-
35
-
36
-
37
-
38
-
39
-
40
-
41
-
42
-
43
-
44
-
45
-
46
-
47
-
48
-
49
-
50
-
51
-
52
-
53
-
54
-
55
-
56
-
57
-
58
-
59
-
60
-
61
-
62
-
63
-
64
-
65
-
66
-
67
-
68
-
69
-
70
-
71
-
72
-
73
-
74
-
75
-
76
-
77
-
78
-
79
-
80
-
81
-
82
-
83
-
84
-
85
-
86
-
87
-
88
-
89
-
90
-
91
-
92
-
93
-
94
-
95
-
96
-
97
-
98
-
99
-
100
-
101
-
102
-
103
-
104
-
105
-
106
-
107
-
108
-
109
-
110
-
111
-
112
-
113
-
114
-
115
-
116
-
117
-
118
-
119
-
120
-
121
-
122
-
123
-
124
-
125
-
126
-
127
-
128
-
129
-
130
-
131
-
132
-
133
-
134
-
135
-
136
-
137
-
138
-
139
-
140
-
141
-
142
-
143
-
144
-
145
-
146
-
147
-
148
-
149
-
150
-
151
-
152
-
153
-
154
-
155
-
156
-
157
-
158
-
159
-
160
-
161
-
162
-
163
-
164
-
165
-
166
-
167
-
168
-
169
-
170
-
171
-
172
-
 173
173 -
 174
174 -
 175
175 -
 176
176 -
 177
177 -
 178
178 -
 179
179 -
 180
180 -
 181
181 -
 182
182 -
 183
183 -
 184
184 -
 185
185 -
 186
186 -
 187
187 -
 188
188 -
 189
189 -
 190
190 -
 191
191 -
 192
192 -
 193
193 -
194
-
195
-
196
-
197
-
198
-
199
-
200
-
201
-
202
-
203
-
204
-
205
-
206
-
207
-
208
-
209
-
210
-
211
-
212
-
213
-
214
-
215
-
216
-
217
-
218
-
219
-
220
-
221
-
222
-
223
-
224
-
225
-
226
-
227
-
228
-
229
-
230
-
231
-
232
-
233
-
234
-
235
-
236
-
237
-
238
-
239
-
240
-
241
-
242
-
243
-
244
-
245
-
246
-
247
-
248
-
249
-
250
-
251
-
252
-
253
-
254
-
255
-
256
-
257
-
258
-
259
-
260
-
261
-
262
-
263
-
264
-
265
-
266
-
267
-
268
-
269
-
270
-
271
-
272
-
273
-
274
-
275
-
276
-
277
-
278
-
279
-
280
-
281
-
282
-
283
-
284
-
285
-
286
-
287
-
288
-
289
-
290
-
291
-
292
-
293
-
294
-
295
-
296
-
297
-
298
-
299
-
300
-
301
-
302
-
303
-
304
-
305
-
306
-
307
-
308
 |
 |

163
PART II
Combined Notes to Consolidated Financial Statements – (Continued)
DUKE ENERGY CORPORATION • DUKE ENERGY CAROLINAS, LLC • PROGRESS ENERGY, INC. • CAROLINA POWER & LIGHT COMPANY d/b/a PROGRESS ENERGY
CAROLINAS, INC. • FLORIDA POWER CORPORATION d/b/a PROGRESS ENERY FLORIDA, INC. • DUKE ENERGY OHIO, INC. • DUKE ENERGY INDIANA, INC.
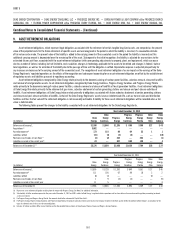
estimate, Progress Energy Florida increased its asset retirement regulatory asset
and its ARO liability by approximately $234 million in 2012. Retail accruals on
Progress Energy Florida’s reserves for nuclear decommissioning were previously
suspended under the terms of previous base rate settlement agreements.
Progress Energy Florida will continue this suspension based on the FPSC’s
approval on April 30, 2012 of its 2010 nuclear decommissioning fi ling. No
nuclear decommissioning reserve accrual is recorded at Progress Energy Florida
following a FERC accounting order issued in November 2006.
The operating licenses for the Duke Energy Registrants’ nuclear units
are subject to extension. The following table includes the current expiration of
nuclear operating licenses.
Unit Year of Expiration
Duke Energy Carolinas
Catawba Unit 1 2043
Catawba Unit 2 2043
McGuire Unit 1 2041
McGuire Unit 2 2043
Oconee Unit 1 2033
Oconee Unit 2 2033
Oconee Unit 3 2034
Progress Energy Carolinas
Brunswick Unit 1 2036
Brunswick Unit 2 2034
Harris 2046
Robinson 2030
Progress Energy Florida
Crystal River Unit 3 2016
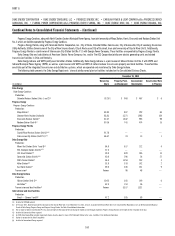
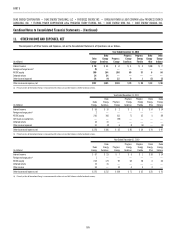
10. PROPERTY, PLANT AND EQUIPMENT
December 31, 2012
(in millions)
Estimated
Useful Life Duke Energy
Duke Energy
Carolinas
Progress
Energy
Progress Energy
Carolinas
Progress Energy
Florida
Duke Energy
Ohio
Duke Energy
Indiana
(Years)
Land $ 1,368 $ 378 $ 618 $ 380 $ 239 $ 136 $ 90
Plant — Regulated
Electric generation, distribution and
transmission
2 – 138 73,181 29,269 30,250 18,009 12,041 3,774 8,622
Natural gas transmission and distribution 12 – 60 2,026 — — — — 2,026 —
Other buildings and improvements 2 – 100 1,319 444 609 283 318 125 149
Plant — Unregulated
Electric generation, distribution and transmission 2 – 100 6,055 — — — — 3,870 —
Other buildings and improvements 9 – 90 2,940 — — — — 191 —
Nuclear fuel 2,127 1,277 850 850 — — —
Equipment 1 – 34 1,448 279 604 336 90 255 141
Construction in process 6,655 1,996 1,424 946 474 204 2,836
Other 5 – 60 3,272 547 791 380 270 243 174
Total property, plant and equipment(a) 100,391 34,190 35,146 21,184 13,432 10,824 12,012
Total accumulated depreciation — regulated(b)(c)(d) (29,471) (11,437) (12,512) (8,185) (4,072) (1,995) (3,692)
Total accumulated depreciation — unregulated(c)(d) (2,498) — — — — (703) —
Generation facilities to be retired, net 136 73 63 63 — — —
Total net property, plant and equipment $ 68,558 $ 22,826 $ 22,697 $13,062 $ 9,360 $ 8,126 $ 8,320
(a) Includes capitalized leases of $1,844 million, $53 million, $339 million, $150 million, $189 million, $86 million, and $28 million at Duke Energy, Duke Energy Carolinas, Progress Energy, Progress Energy Carolinas, Progress
Energy Florida, Duke Energy Ohio, and Duke Energy Indiana, respectively, primarily in regulated plant. The Progress Energy, Progress Energy Carolinas and Progress Energy Florida amounts are net of $49 million, an
insignifi cant amount and $48 million, respectively, of accumulated amortization of capitalized leases.
(b) Includes $857 million, $557 million, $300 million and $300 million of accumulated amortization of nuclear fuel at Duke Energy, Duke Energy Carolinas, Progress Energy and Progress Energy Carolinas, respectively.
(c) Includes accumulated amortization of capitalized leases of $34 million, $3 million, $12 million and $5 million at Duke Energy, Duke Energy Carolinas, Duke Energy Ohio and Duke Energy Indiana, respectively.
(d) Includes accumulated depreciation of VIEs of $103 million and an insignifi cant amount at December 31, 2012 at Duke Energy and Progress Energy, respectively.