Duke Energy 2012 Annual Report Download - page 111
Download and view the complete annual report
Please find page 111 of the 2012 Duke Energy annual report below. You can navigate through the pages in the report by either clicking on the pages listed below, or by using the keyword search tool below to find specific information within the annual report.-
 1
1 -
2
-
3
-
4
-
5
-
6
-
7
-
8
-
9
-
10
-
11
-
12
-
13
-
14
-
15
-
16
-
17
-
18
-
19
-
20
-
21
-
22
-
23
-
24
-
25
-
26
-
27
-
28
-
29
-
30
-
31
-
32
-
33
-
34
-
35
-
36
-
37
-
38
-
39
-
40
-
41
-
42
-
43
-
44
-
45
-
46
-
47
-
48
-
49
-
50
-
51
-
52
-
53
-
54
-
55
-
56
-
57
-
58
-
59
-
60
-
61
-
62
-
63
-
64
-
65
-
66
-
67
-
68
-
69
-
70
-
71
-
72
-
73
-
74
-
75
-
76
-
77
-
78
-
79
-
80
-
81
-
82
-
83
-
84
-
85
-
86
-
87
-
88
-
89
-
90
-
91
-
92
-
93
-
94
-
95
-
96
-
97
-
98
-
99
-
100
-
 101
101 -
 102
102 -
 103
103 -
 104
104 -
 105
105 -
 106
106 -
 107
107 -
 108
108 -
 109
109 -
 110
110 -
 111
111 -
 112
112 -
 113
113 -
 114
114 -
 115
115 -
 116
116 -
 117
117 -
 118
118 -
 119
119 -
 120
120 -
 121
121 -
122
-
123
-
124
-
125
-
126
-
127
-
128
-
129
-
130
-
131
-
132
-
133
-
134
-
135
-
136
-
137
-
138
-
139
-
140
-
141
-
142
-
143
-
144
-
145
-
146
-
147
-
148
-
149
-
150
-
151
-
152
-
153
-
154
-
155
-
156
-
157
-
158
-
159
-
160
-
161
-
162
-
163
-
164
-
165
-
166
-
167
-
168
-
169
-
170
-
171
-
172
-
173
-
174
-
175
-
176
-
177
-
178
-
179
-
180
-
181
-
182
-
183
-
184
-
185
-
186
-
187
-
188
-
189
-
190
-
191
-
192
-
193
-
194
-
195
-
196
-
197
-
198
-
199
-
200
-
201
-
202
-
203
-
204
-
205
-
206
-
207
-
208
-
209
-
210
-
211
-
212
-
213
-
214
-
215
-
216
-
217
-
218
-
219
-
220
-
221
-
222
-
223
-
224
-
225
-
226
-
227
-
228
-
229
-
230
-
231
-
232
-
233
-
234
-
235
-
236
-
237
-
238
-
239
-
240
-
241
-
242
-
243
-
244
-
245
-
246
-
247
-
248
-
249
-
250
-
251
-
252
-
253
-
254
-
255
-
256
-
257
-
258
-
259
-
260
-
261
-
262
-
263
-
264
-
265
-
266
-
267
-
268
-
269
-
270
-
271
-
272
-
273
-
274
-
275
-
276
-
277
-
278
-
279
-
280
-
281
-
282
-
283
-
284
-
285
-
286
-
287
-
288
-
289
-
290
-
291
-
292
-
293
-
294
-
295
-
296
-
297
-
298
-
299
-
300
-
301
-
302
-
303
-
304
-
305
-
306
-
307
-
308
 |
 |

91
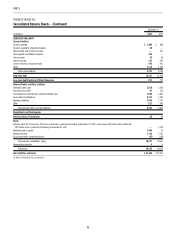
PART II
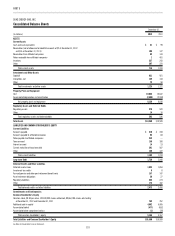
December 31,
(in millions) 2012 2011
ASSETS
Current Assets
Cash and cash equivalents $ 18 $ 20
Receivables (net of allowance for doubtful accounts of $9 at December 31, 2012 and 2011) 458 492
Receivables from affi liated companies 5 1
Inventory 828 770
Other 313 226
Total current assets 1,622 1,509
Investments and Other Assets
Nuclear decommissioning trust funds 1,259 1,088
Other 251 210
Total investments and other assets 1,510 1,298
Property, Plant and Equipment
Cost 21,168 19,367
Cost, variable interest entities 16 16
Accumulated depreciation and amortization (8,185) (7,991)
Generation facilities to be retired, net 63 163
Net property, plant and equipment 13,062 11,555
Regulatory Assets and Deferred Debits
Regulatory assets 1,845 1,682
Other 29 22
Total regulatory assets and deferred debits 1,874 1,704
Total Assets $18,068 $16,066
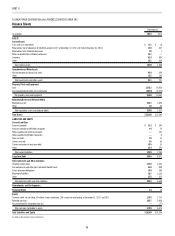
LIABILITIES AND EQUITY
Current Liabilities
Accounts payable $ 542 $ 518
Accounts payable to affi liated companies 76 29
Notes payable and commercial paper —188
Notes payable to affi liated companies 364 31
Taxes accrued 23 23
Interest accrued 69 77
Current maturities of long-term debt 407 502
Other 517 417
Total current liabilities 1,998 1,785
Long-term Debt 4,433 3,704
Deferred Credits and Other Liabilities
Deferred income taxes 2,162 1,903
Investment tax credits 92 98
Accrued pension and other post-retirement benefi t costs 715 687
Asset retirement obligations 1,649 896
Regulatory liabilities 1,538 1,543
Other 295 303
Total deferred credits and other liabilities 6,451 5,430
Commitments and Contingencies
Preferred Stock 59 59
Equity
Common stock, no par value, 200 million shares authorized; 160 million shares issued and outstanding at December 31, 2012 and 2011 2,159 2,148
Retained earnings 2,968 3,011
Accumulated other comprehensive loss —(71)
Total common stockholder’s equity 5,127 5,088
Total Liabilities and Equity $ 18,068 $16,066
See Notes to Consolidated Financial Statements
CAROLINA POWER & LIGHT COMPANY d/b/a PROGRESS ENERGY CAROLINAS, INC.
Consolidated Balance Sheets