Duke Energy 2012 Annual Report Download - page 76
Download and view the complete annual report
Please find page 76 of the 2012 Duke Energy annual report below. You can navigate through the pages in the report by either clicking on the pages listed below, or by using the keyword search tool below to find specific information within the annual report.-
 1
1 -
2
-
3
-
4
-
5
-
6
-
7
-
8
-
9
-
10
-
11
-
12
-
13
-
14
-
15
-
16
-
17
-
18
-
19
-
20
-
21
-
22
-
23
-
24
-
25
-
26
-
27
-
28
-
29
-
30
-
31
-
32
-
33
-
34
-
35
-
36
-
37
-
38
-
39
-
40
-
41
-
42
-
43
-
44
-
45
-
46
-
47
-
48
-
49
-
50
-
51
-
52
-
53
-
54
-
55
-
56
-
57
-
58
-
59
-
60
-
61
-
62
-
63
-
64
-
65
-
 66
66 -
 67
67 -
 68
68 -
 69
69 -
 70
70 -
 71
71 -
 72
72 -
 73
73 -
 74
74 -
 75
75 -
 76
76 -
 77
77 -
 78
78 -
 79
79 -
 80
80 -
 81
81 -
 82
82 -
 83
83 -
 84
84 -
 85
85 -
 86
86 -
87
-
88
-
89
-
90
-
91
-
92
-
93
-
94
-
95
-
96
-
97
-
98
-
99
-
100
-
101
-
102
-
103
-
104
-
105
-
106
-
107
-
108
-
109
-
110
-
111
-
112
-
113
-
114
-
115
-
116
-
117
-
118
-
119
-
120
-
121
-
122
-
123
-
124
-
125
-
126
-
127
-
128
-
129
-
130
-
131
-
132
-
133
-
134
-
135
-
136
-
137
-
138
-
139
-
140
-
141
-
142
-
143
-
144
-
145
-
146
-
147
-
148
-
149
-
150
-
151
-
152
-
153
-
154
-
155
-
156
-
157
-
158
-
159
-
160
-
161
-
162
-
163
-
164
-
165
-
166
-
167
-
168
-
169
-
170
-
171
-
172
-
173
-
174
-
175
-
176
-
177
-
178
-
179
-
180
-
181
-
182
-
183
-
184
-
185
-
186
-
187
-
188
-
189
-
190
-
191
-
192
-
193
-
194
-
195
-
196
-
197
-
198
-
199
-
200
-
201
-
202
-
203
-
204
-
205
-
206
-
207
-
208
-
209
-
210
-
211
-
212
-
213
-
214
-
215
-
216
-
217
-
218
-
219
-
220
-
221
-
222
-
223
-
224
-
225
-
226
-
227
-
228
-
229
-
230
-
231
-
232
-
233
-
234
-
235
-
236
-
237
-
238
-
239
-
240
-
241
-
242
-
243
-
244
-
245
-
246
-
247
-
248
-
249
-
250
-
251
-
252
-
253
-
254
-
255
-
256
-
257
-
258
-
259
-
260
-
261
-
262
-
263
-
264
-
265
-
266
-
267
-
268
-
269
-
270
-
271
-
272
-
273
-
274
-
275
-
276
-
277
-
278
-
279
-
280
-
281
-
282
-
283
-
284
-
285
-
286
-
287
-
288
-
289
-
290
-
291
-
292
-
293
-
294
-
295
-
296
-
297
-
298
-
299
-
300
-
301
-
302
-
303
-
304
-
305
-
306
-
307
-
308
 |
 |

56
PART II
LIQUIDITY AND CAPITAL RESOURCES
Overview
At December 31, 2012, Duke Energy had cash and cash equivalents
and short-term investments of $1.8 billion, of which $1.1 billion is held in
foreign jurisdictions and is forecasted to be used to fund the operations of and
investments in International Energy. To fund its domestic liquidity and capital
requirements, Duke Energy relies primarily upon cash fl ows from operations,
borrowings, and its existing cash and cash equivalents. The relatively stable
operating cash fl ows of USFE&G compose a substantial portion of Duke Energy’s
cash fl ows from operations and it is anticipated that it will continue to do so for
the foreseeable future. A material adverse change in operations, or in available
fi nancing, could impact Duke Energy’s ability to fund its current liquidity and
capital resource requirements. Weather conditions, commodity price fl uctuations
and unanticipated expenses, including unplanned plant outages and storms,
could affect the timing and level of internally generated funds.
Ultimate cash fl ows from operations are subject to a number of factors,
including, but not limited to, regulatory constraints, economic trends and market
volatility (see Item 1A. “Risk Factors” for details).
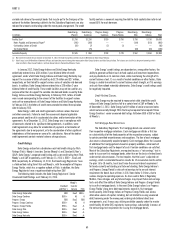
Duke Energy’s projected capital and investment expenditures for the next
three fi scal years are included in the table below.
(in millions) 2013 2014 2015
U.S. Franchised Electric and Gas $5,300 $5,025 $5,400
Commercial Power, International Energy and Other 575 375 350
Total committed expenditures 5,875 5,400 5,750
Discretionary expenditures 425 625 600
Total projected capital and investment expenditures $6,300 $6,025 $6,350
Duke Energy continues to focus on reducing risk and positioning its business
for future success and will invest principally in its strongest business sectors. Based
on this goal, the majority of Duke Energy’s total projected capital expenditures are
allocated to the USFE&G segment. The table below includes the components of
projected capital expenditures for USFE&G for the next three fi scal years.
2013 2014 2015
Infrastructure growth and nuclear projects 28 % 29 % 35 %
Maintenance 57 % 51 % 44 %
Nuclear fuel 9 % 11 % 10 %
Environmental 6 % 9 % 11 %
Total projected U.S. Franchised Electric and Gas capital and
investment expenditures 100 % 100 % 100 %
With respect to the 2013 capital expenditure plan, Duke Energy has
fl exibility within its $6.3 billion budget to defer or eliminate certain spending
should economic or fi nancing conditions deteriorate. Of the $6.3 billion budget,
$1.3 billion relates to projects for which management has committed capital,
including, but not limited to, the fi nal construction of the Edwardsport IGCC
plant and the Sutton combined cycle gas-fi red facility, and management intends
to spend those capital dollars in 2013 irrespective of broader economic factors.
$4.6 billion of projected 2013 capital expenditures are expected to be used
primarily for overall system maintenance and upgrades, customer connections,
compliance with new environmental requirements and corporate capital
expenditures. Although these expenditures are ultimately necessary to ensure
overall system maintenance and reliability, the timing of the expenditures
may be infl uenced by broad economic conditions and customer growth, thus
management has more fl exibility in terms of when these dollars are actually
spent. The remaining planned 2013 capital expenditures of $0.4 billion are of
a discretionary nature and relate to growth opportunities in which Duke Energy
may invest, provided there are opportunities that meet return expectations.
As a result of Duke Energy’s signifi cant commitment to modernize
its generating fl eet through the construction of new units, the ability to cost
effectively manage the construction phase of current and future projects is
critical to ensuring full and timely recovery of costs of construction. Should Duke
Energy encounter signifi cant cost overruns above amounts approved by the
various state commissions, and those amounts are disallowed for recovery in
rates, or if construction costs of renewable generation exceed amounts provided
through power sales agreements and tax credits, future cash fl ows and results
of operations could be adversely impacted.
Duke Energy’s capitalization is balanced between debt and equity as
shown in the table below.
Projected
2013
Actual
2012
Actual
2011
Equity 50 % 50 % 52 %
Debt 50 % 50 % 48 %
Duke Energy’s fi xed charges coverage ratio, calculated using SEC
guidelines, was 2.5 times for 2012, 3.2 times for 2011, and 3.0 times for 2010.
In 2013, Duke Energy currently anticipates issuing additional debt of
$4.3 billion, primarily for the purpose of funding capital expenditures and
debt maturities. Due to the fl exibility in the timing of projected 2013 capital
expenditures, the timing and amount of debt issuances throughout 2013 could
be infl uenced by changes in capital spending.
Duke Energy has access to a $6 billion master credit facility, which is not
restricted upon general market conditions. At December 31, 2012, Duke Energy
has available borrowing capacity of $4.9 billion under this facility. Management
currently believes that amounts available under its revolving master credit
facility are accessible should there be a need to generate additional short-term
fi nancing in 2013. Management expects that cash fl ows from operations and
issuances of debt will be suffi cient to cover the 2013 funding requirements
related to capital and investments expenditures, dividend payments and debt
maturities. See “Credit Facilities” section below for additional information
regarding Duke Energy’s credit facility.
Duke Energy monitors compliance with all debt covenants and restrictions
and does not currently believe it will be in violation or breach of its signifi cant
debt covenants during 2013. However, circumstances could arise that may alter
that view. If and when management had a belief that such potential breach
could exist, appropriate action would be taken to mitigate any such issue. Duke
Energy also maintains an active dialogue with the credit rating agencies.
Duke Energy periodically evaluates the impact of repatriation of cash
generated and held in foreign countries. Duke Energy’s current intent is to
indefi nitely reinvest foreign earnings. However, circumstances could arise that may
alter that view, including a future change in tax law governing U.S. taxation of foreign
earnings. If Duke Energy were to decide to repatriate foreign generated and held
cash, recognition of material U.S. federal income tax liabilities could be required.
Cash Flow Information
The following table summarizes Duke Energy’s cash fl ows for the three
most recently completed fi scal years.
Years Ended December 31,
(in millions) 2012 2011 2010
Cash fl ows provided by (used in):
Operating activities $ 5,244 $ 3,672 $ 4,511
Investing activities (6,197) (4,434) (4,423)
Financing activities 267 1,202 40
Net (decrease) increase in cash and cash equivalents (686) 440 128
Cash and cash equivalents at beginning of period 2,110 1,670 1,542
Cash and cash equivalents at end of period $ 1,424 $ 2,110 $ 1,670