Duke Energy 2012 Annual Report Download - page 146
Download and view the complete annual report
Please find page 146 of the 2012 Duke Energy annual report below. You can navigate through the pages in the report by either clicking on the pages listed below, or by using the keyword search tool below to find specific information within the annual report.-
 1
1 -
2
-
3
-
4
-
5
-
6
-
7
-
8
-
9
-
10
-
11
-
12
-
13
-
14
-
15
-
16
-
17
-
18
-
19
-
20
-
21
-
22
-
23
-
24
-
25
-
26
-
27
-
28
-
29
-
30
-
31
-
32
-
33
-
34
-
35
-
36
-
37
-
38
-
39
-
40
-
41
-
42
-
43
-
44
-
45
-
46
-
47
-
48
-
49
-
50
-
51
-
52
-
53
-
54
-
55
-
56
-
57
-
58
-
59
-
60
-
61
-
62
-
63
-
64
-
65
-
66
-
67
-
68
-
69
-
70
-
71
-
72
-
73
-
74
-
75
-
76
-
77
-
78
-
79
-
80
-
81
-
82
-
83
-
84
-
85
-
86
-
87
-
88
-
89
-
90
-
91
-
92
-
93
-
94
-
95
-
96
-
97
-
98
-
99
-
100
-
101
-
102
-
103
-
104
-
105
-
106
-
107
-
108
-
109
-
110
-
111
-
112
-
113
-
114
-
115
-
116
-
117
-
118
-
119
-
120
-
121
-
122
-
123
-
124
-
125
-
126
-
127
-
128
-
129
-
130
-
131
-
132
-
133
-
134
-
135
-
 136
136 -
 137
137 -
 138
138 -
 139
139 -
 140
140 -
 141
141 -
 142
142 -
 143
143 -
 144
144 -
 145
145 -
 146
146 -
 147
147 -
 148
148 -
 149
149 -
 150
150 -
 151
151 -
 152
152 -
 153
153 -
 154
154 -
 155
155 -
 156
156 -
157
-
158
-
159
-
160
-
161
-
162
-
163
-
164
-
165
-
166
-
167
-
168
-
169
-
170
-
171
-
172
-
173
-
174
-
175
-
176
-
177
-
178
-
179
-
180
-
181
-
182
-
183
-
184
-
185
-
186
-
187
-
188
-
189
-
190
-
191
-
192
-
193
-
194
-
195
-
196
-
197
-
198
-
199
-
200
-
201
-
202
-
203
-
204
-
205
-
206
-
207
-
208
-
209
-
210
-
211
-
212
-
213
-
214
-
215
-
216
-
217
-
218
-
219
-
220
-
221
-
222
-
223
-
224
-
225
-
226
-
227
-
228
-
229
-
230
-
231
-
232
-
233
-
234
-
235
-
236
-
237
-
238
-
239
-
240
-
241
-
242
-
243
-
244
-
245
-
246
-
247
-
248
-
249
-
250
-
251
-
252
-
253
-
254
-
255
-
256
-
257
-
258
-
259
-
260
-
261
-
262
-
263
-
264
-
265
-
266
-
267
-
268
-
269
-
270
-
271
-
272
-
273
-
274
-
275
-
276
-
277
-
278
-
279
-
280
-
281
-
282
-
283
-
284
-
285
-
286
-
287
-
288
-
289
-
290
-
291
-
292
-
293
-
294
-
295
-
296
-
297
-
298
-
299
-
300
-
301
-
302
-
303
-
304
-
305
-
306
-
307
-
308
 |
 |

126
PART II
Combined Notes to Consolidated Financial Statements – (Continued)
DUKE ENERGY CORPORATION • DUKE ENERGY CAROLINAS, LLC • PROGRESS ENERGY, INC. • CAROLINA POWER & LIGHT COMPANY d/b/a PROGRESS ENERGY
CAROLINAS, INC. • FLORIDA POWER CORPORATION d/b/a PROGRESS ENERY FLORIDA, INC. • DUKE ENERGY OHIO, INC. • DUKE ENERGY INDIANA, INC.
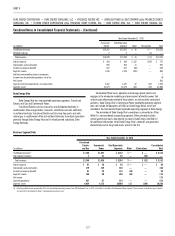
Business Segment Data
Year Ended December 31, 2012
(in millions)
Franchised
Electric
Total Reportable
Segment Other Eliminations Total
Unaffi liated revenues $ 9,305 $ 9,305 $ 12 $ — $ 9,317
Affi liated revenues 90 90 — (2) 88
Total revenues $ 9,395 $ 9,395 $ 12 $ (2) $ 9,405
Interest expense $ 459 $ 459 $ 304 $(23) $ 740
Depreciation and amortization 727 727 20 — 747
Income tax expense (benefi t) 384 384 (212) — 172
Segment income(a)(b) 727 727 (379) — 348
Add back noncontrolling interest component 7
Income from discontinued operations, net of tax 52
Net income 407
Capital investment expenditures and acquisitions 2,334 2,334 32 — 2,366
Segment assets 36,764 36,764 684 (43) 37,405
(a) Franchised Electric recorded an $88 million impairment, net of tax of $58 million, related to the decision to retire Crystal River Unit 3 and a $60 million charge, net of tax of $40 million, to record a regulatory liability related
to replacement power obligations as a result of the Crystal River Unit 3 outage. These charges were not applicable to Duke Energy as this reporting unit has a lower carrying value at Duke Energy. See Note 4 for additional
information.
(b) Other includes after-tax costs to achieve the merger with Duke Energy of $198 million, net of tax of $127 million. See Note 2 for additional information.
Year Ended December 31, 2011
(in millions)
Franchised
Electric
Total Reportable
Segment Other Eliminations Total
Unaffi liated revenues(a) $ 8,936 $ 8,936 $ 12 $ — $ 8,948
Affi liated revenues 3 3 — (3) —
Total revenues $ 8,939 $ 8,939 $ 12 $ (3) $ 8,948
Interest expense $ 423 $ 423 $ 324 $ (22) $ 725
Depreciation and amortization 683 683 18 — 701
Income tax expense (benefi t) 436 436 (113) — 323
Segment income(a)(b) 853 853 (273) — 580
Add back noncontrolling interest component 7
Income from discontinued operations, net of tax (5)
Net income 582
Capital investment expenditures and acquisitions 2,239 2,239 17 — 2,256
Segment assets 34,166 34,166 765 — 34,931
(a) Franchised Electric recorded a $173 million charge, net of tax of $115 million, for the amount to be refunded to customers through the fuel clause in accordance with the FPSC’s 2012 settlement agreement. See Note 4 for
additional information.
(b) Other includes after-tax costs to achieve the merger with Duke Energy of $33 million, net of tax of $22 million. See Note 2 for additional information.