Duke Energy 2012 Annual Report Download - page 249
Download and view the complete annual report
Please find page 249 of the 2012 Duke Energy annual report below. You can navigate through the pages in the report by either clicking on the pages listed below, or by using the keyword search tool below to find specific information within the annual report.-
 1
1 -
2
-
3
-
4
-
5
-
6
-
7
-
8
-
9
-
10
-
11
-
12
-
13
-
14
-
15
-
16
-
17
-
18
-
19
-
20
-
21
-
22
-
23
-
24
-
25
-
26
-
27
-
28
-
29
-
30
-
31
-
32
-
33
-
34
-
35
-
36
-
37
-
38
-
39
-
40
-
41
-
42
-
43
-
44
-
45
-
46
-
47
-
48
-
49
-
50
-
51
-
52
-
53
-
54
-
55
-
56
-
57
-
58
-
59
-
60
-
61
-
62
-
63
-
64
-
65
-
66
-
67
-
68
-
69
-
70
-
71
-
72
-
73
-
74
-
75
-
76
-
77
-
78
-
79
-
80
-
81
-
82
-
83
-
84
-
85
-
86
-
87
-
88
-
89
-
90
-
91
-
92
-
93
-
94
-
95
-
96
-
97
-
98
-
99
-
100
-
101
-
102
-
103
-
104
-
105
-
106
-
107
-
108
-
109
-
110
-
111
-
112
-
113
-
114
-
115
-
116
-
117
-
118
-
119
-
120
-
121
-
122
-
123
-
124
-
125
-
126
-
127
-
128
-
129
-
130
-
131
-
132
-
133
-
134
-
135
-
136
-
137
-
138
-
139
-
140
-
141
-
142
-
143
-
144
-
145
-
146
-
147
-
148
-
149
-
150
-
151
-
152
-
153
-
154
-
155
-
156
-
157
-
158
-
159
-
160
-
161
-
162
-
163
-
164
-
165
-
166
-
167
-
168
-
169
-
170
-
171
-
172
-
173
-
174
-
175
-
176
-
177
-
178
-
179
-
180
-
181
-
182
-
183
-
184
-
185
-
186
-
187
-
188
-
189
-
190
-
191
-
192
-
193
-
194
-
195
-
196
-
197
-
198
-
199
-
200
-
201
-
202
-
203
-
204
-
205
-
206
-
207
-
208
-
209
-
210
-
211
-
212
-
213
-
214
-
215
-
216
-
217
-
218
-
219
-
220
-
221
-
222
-
223
-
224
-
225
-
226
-
227
-
228
-
229
-
230
-
231
-
232
-
233
-
234
-
235
-
236
-
237
-
238
-
 239
239 -
 240
240 -
 241
241 -
 242
242 -
 243
243 -
 244
244 -
 245
245 -
 246
246 -
 247
247 -
 248
248 -
 249
249 -
 250
250 -
 251
251 -
 252
252 -
 253
253 -
 254
254 -
 255
255 -
 256
256 -
 257
257 -
 258
258 -
 259
259 -
260
-
261
-
262
-
263
-
264
-
265
-
266
-
267
-
268
-
269
-
270
-
271
-
272
-
273
-
274
-
275
-
276
-
277
-
278
-
279
-
280
-
281
-
282
-
283
-
284
-
285
-
286
-
287
-
288
-
289
-
290
-
291
-
292
-
293
-
294
-
295
-
296
-
297
-
298
-
299
-
300
-
301
-
302
-
303
-
304
-
305
-
306
-
307
-
308
 |
 |

229
PART II
DUKE ENERGY CORPORATION • DUKE ENERGY CAROLINAS, LLC • PROGRESS ENERGY, INC. • CAROLINA POWER & LIGHT COMPANY d/b/a PROGRESS
ENERGY CAROLINAS, INC. • FLORIDA POWER CORPORATION d/b/a PROGRESS ENERY FLORIDA, INC. • DUKE ENERGY OHIO, INC. • DUKE ENERGY INDIANA, INC.
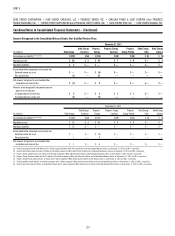
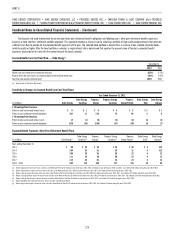
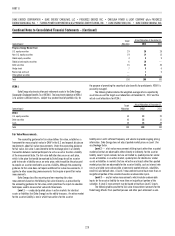
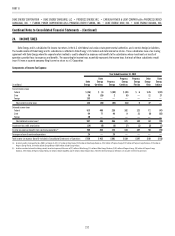
Combined Notes to Consolidated Financial Statements – (Continued)
December 31, 2012
(in millions) Total Fair Value(a) Level 1 Level 2 Level 3
Duke Energy Master Trust
Equity securities $2,993 $1,415 $1,575 $ 3
Corporate bonds 1,391 — 1,388 3
Short-term investment funds 100 23 77 —
Partnership interests 141 — — 141
Hedge funds 97 — 97 —
Real estate trusts 167 — — 167
U.S. government securities 237 — 237 —
Other investments(b) (16) (21) 5 —
Guaranteed investment contracts 37 — — 37
Governments bonds — foreign 65 — 64 1
Cash 4 4 — —
Asset backed securities 2 — 2 —
Government and commercial mortgage backed securities 12 — 12 —
Total assets(c) $5,230 $1,421 $3,457 $352
(a) Excludes $26 million in net receivables associated with security purchases and sales.
(b) Includes pending investment sales (net of investment purchases) of $29 million.
(c) Duke Energy Carolinas, Duke Energy Ohio and Duke Energy Indiana were allocated approximately 43%, 9% and 12% of the Duke Energy Master Trust assets at December 31, 2012, respectively. Accordingly, all Level 1, 2 and
3 amounts included in the table above are allocable to Duke Energy Carolinas, Duke Energy Ohio and Duke Energy Indiana using these percentages.
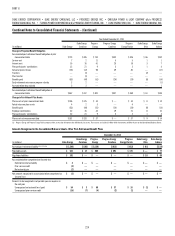
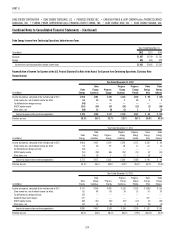
December 31, 2011
(in millions) Total Fair Value(a) Level 1 Level 2 Level 3
Duke Energy Master Trust
Equity securities $2,568 $1,745 $ 823 $ —
Corporate bonds 1,237 — 1,236 1
Short-term investment funds 328 276 52 —
Partnership interests 127 — — 127
Hedge funds 89 — 89 —
Real estate trusts 152 — — 152
U.S. government securities 211 — 211 —
Other investments(b) 33 30 2 1
Guarantees investment contracts 39 — — 39
Governments bonds - foreign 39 — 38 1
Cash 7 7 — —
Asset backed securities 4 — 3 1
Government and commercial mortgage backed securities 8 — 8 —
Total assets(c) $ 4,842 $2,058 $2,462 $322
(a) Excludes $27 million in net receivables and payables associated with security purchases and sales.
(b) Includes pending investment sales (net of investment purchases) of $3 million.
(c) Duke Energy Carolinas, Duke Energy Ohio and Duke Energy Indiana were allocated approximately 39%, 12% and 12% of the Duke Energy Master Trust assets at December 31, 2012, respectively. Accordingly, all Level 1, 2 and
3 amounts included in the table above are allocable to Duke Energy Carolinas, Duke Energy Ohio and Duke Energy Indiana using these percentages.