Duke Energy 2012 Annual Report Download - page 148
Download and view the complete annual report
Please find page 148 of the 2012 Duke Energy annual report below. You can navigate through the pages in the report by either clicking on the pages listed below, or by using the keyword search tool below to find specific information within the annual report.-
 1
1 -
2
-
3
-
4
-
5
-
6
-
7
-
8
-
9
-
10
-
11
-
12
-
13
-
14
-
15
-
16
-
17
-
18
-
19
-
20
-
21
-
22
-
23
-
24
-
25
-
26
-
27
-
28
-
29
-
30
-
31
-
32
-
33
-
34
-
35
-
36
-
37
-
38
-
39
-
40
-
41
-
42
-
43
-
44
-
45
-
46
-
47
-
48
-
49
-
50
-
51
-
52
-
53
-
54
-
55
-
56
-
57
-
58
-
59
-
60
-
61
-
62
-
63
-
64
-
65
-
66
-
67
-
68
-
69
-
70
-
71
-
72
-
73
-
74
-
75
-
76
-
77
-
78
-
79
-
80
-
81
-
82
-
83
-
84
-
85
-
86
-
87
-
88
-
89
-
90
-
91
-
92
-
93
-
94
-
95
-
96
-
97
-
98
-
99
-
100
-
101
-
102
-
103
-
104
-
105
-
106
-
107
-
108
-
109
-
110
-
111
-
112
-
113
-
114
-
115
-
116
-
117
-
118
-
119
-
120
-
121
-
122
-
123
-
124
-
125
-
126
-
127
-
128
-
129
-
130
-
131
-
132
-
133
-
134
-
135
-
136
-
137
-
 138
138 -
 139
139 -
 140
140 -
 141
141 -
 142
142 -
 143
143 -
 144
144 -
 145
145 -
 146
146 -
 147
147 -
 148
148 -
 149
149 -
 150
150 -
 151
151 -
 152
152 -
 153
153 -
 154
154 -
 155
155 -
 156
156 -
 157
157 -
 158
158 -
159
-
160
-
161
-
162
-
163
-
164
-
165
-
166
-
167
-
168
-
169
-
170
-
171
-
172
-
173
-
174
-
175
-
176
-
177
-
178
-
179
-
180
-
181
-
182
-
183
-
184
-
185
-
186
-
187
-
188
-
189
-
190
-
191
-
192
-
193
-
194
-
195
-
196
-
197
-
198
-
199
-
200
-
201
-
202
-
203
-
204
-
205
-
206
-
207
-
208
-
209
-
210
-
211
-
212
-
213
-
214
-
215
-
216
-
217
-
218
-
219
-
220
-
221
-
222
-
223
-
224
-
225
-
226
-
227
-
228
-
229
-
230
-
231
-
232
-
233
-
234
-
235
-
236
-
237
-
238
-
239
-
240
-
241
-
242
-
243
-
244
-
245
-
246
-
247
-
248
-
249
-
250
-
251
-
252
-
253
-
254
-
255
-
256
-
257
-
258
-
259
-
260
-
261
-
262
-
263
-
264
-
265
-
266
-
267
-
268
-
269
-
270
-
271
-
272
-
273
-
274
-
275
-
276
-
277
-
278
-
279
-
280
-
281
-
282
-
283
-
284
-
285
-
286
-
287
-
288
-
289
-
290
-
291
-
292
-
293
-
294
-
295
-
296
-
297
-
298
-
299
-
300
-
301
-
302
-
303
-
304
-
305
-
306
-
307
-
308
 |
 |

128
PART II
Combined Notes to Consolidated Financial Statements – (Continued)
DUKE ENERGY CORPORATION • DUKE ENERGY CAROLINAS, LLC • PROGRESS ENERGY, INC. • CAROLINA POWER & LIGHT COMPANY d/b/a PROGRESS ENERGY
CAROLINAS, INC. • FLORIDA POWER CORPORATION d/b/a PROGRESS ENERY FLORIDA, INC. • DUKE ENERGY OHIO, INC. • DUKE ENERGY INDIANA, INC.
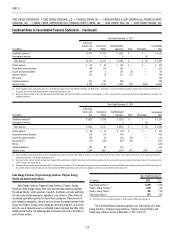
Year Ended December 31, 2011
(in millions)
Franchised
Electric and
Gas
Commercial
Power
Total Reportable
Segments Other Eliminations
Consolidated
Total
Unaffi liated revenues(a) $1,474 $1,707 $ 3,181 $ —$ — $ 3,181
Intersegment revenues — 4 4 — (4) —
Total revenues $1,474 $1,711 $ 3,185 $ — $ (4) $ 3,181
Interest expense $ 68 $ 36 $ 104 $ — $ — $ 104
Depreciation and amortization 168 167 335 — — 335
Income tax expense (benefi t) 98 6 104 (8) — 96
Segment income(b) 133 78 211 (17) — 194
Net income 194
Capital expenditures 375 124 499 — — 499
Segment assets 6,293 4,740 11,033 259 (353) 10,939
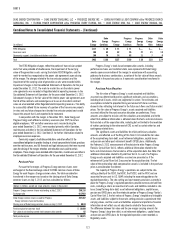
(a) Duke Energy Ohio earned approximately 24% of its consolidated operating revenues from PJM Interconnection, LLC (PJM) in 2011, all of which is included in the Commercial Power segment. These revenues relate to the sale
of capacity and electricity from Commercial Power’s nonregulated generation assets.
(b) Commercial Power recorded an after-tax impairment charge of $51 million, net of tax of $28 million, during the year ended December 31, 2011, to write-down the carrying value of certain emission allowances. See Note 12 for
additional information.
Year Ended December 31, 2010
(in millions)
Franchised
Electric and
Gas
Commercial
Power
Total Reportable
Segments Other Eliminations
Consolidated
Total
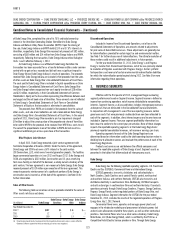
Unaffi liated revenues(a) $1,623 $1,706 $ 3,329 $ — $ — $ 3,329
Intersegment revenues — 5 5 — (5) —
Total revenues $1,623 $1,711 $ 3,334 $ — $ (5) $ 3,329
Interest expense $ 68 $ 41 $ 109 $ — $ — $ 109
Depreciation and amortization 226 174 400 — — 400
Income tax expense (benefi t) 106 40 146 (14) — 132
Segment loss(b)(c) (61) (361) (422) (19) — (441)
Net loss (441)
Capital expenditures 353 93 446 — — 446
Segment assets 6,258 4,821 11,079 192 (247) 11,024
(a) Duke Energy Ohio earned approximately 13% of its consolidated operating revenues from PJM in 2010, all of which is included in the Commercial Power segment. These revenues relate to the sale of capacity and electricity
from Commercial Power’s nonregulated generation assets.
(b) Franchised Electric and Gas recorded an impairment charge of $216 million related to the Ohio Transmission and Distribution reporting unit. This impairment charge was not applicable to Duke Energy as this reporting unit has
a lower carrying value at Duke Energy.
(c) Commercial Power recorded impairment charges of $621 million, which consisted of a $461 million goodwill impairment charge associated with the nonregulated Midwest generation operations and a $102 million charge, net
of tax of $58 million, to write-down the value of certain nonregulated Midwest generating assets and emission allowances primarily associated with these generation assets.
Duke Energy Carolinas, Progress Energy Carolinas, Progress Energy
Florida and Duke Energy Indiana
Duke Energy Carolinas, Progress Energy Carolinas, Progress Energy
Florida and Duke Energy Indiana each have one reportable operating segment,
Franchised Electric, which generates, transmits, distributes and sells electricity.
The remainder of each companies’ operations is classifi ed as Other. While not
considered reportable segments for any of these companies, Other consists of
each respective companies’ share of costs to achieve the merger between Duke
Energy and Progress Energy, certain corporate severance programs, and certain
costs for use of corporate assets as allocated to each company. See Note 14 for
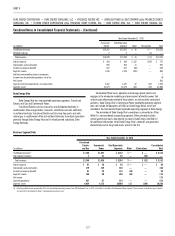
additional information. The following table summarizes the net loss for Other at
each of these entities.
Years Ended December 31,
(in millions) 2012 2011
Duke Energy Carolinas(a) $(169) $ (46)
Progress Energy Carolinas(a) (139) (18)
Progress Energy Florida(a) (58) (16)
Duke Energy Indiana(a) (27)(12)
(a) The net loss for the year ended December 31, 2010, recorded in Other was not material.
The Franchised Electric operating segments own substantially all of Duke
Energy Carolinas’, Progress Energy Carolinas’, Progress Energy Florida’s and
Duke Energy Indiana’s assets at December 31, 2012 and 2011.