Duke Energy 2012 Annual Report Download - page 259
Download and view the complete annual report
Please find page 259 of the 2012 Duke Energy annual report below. You can navigate through the pages in the report by either clicking on the pages listed below, or by using the keyword search tool below to find specific information within the annual report.-
 1
1 -
2
-
3
-
4
-
5
-
6
-
7
-
8
-
9
-
10
-
11
-
12
-
13
-
14
-
15
-
16
-
17
-
18
-
19
-
20
-
21
-
22
-
23
-
24
-
25
-
26
-
27
-
28
-
29
-
30
-
31
-
32
-
33
-
34
-
35
-
36
-
37
-
38
-
39
-
40
-
41
-
42
-
43
-
44
-
45
-
46
-
47
-
48
-
49
-
50
-
51
-
52
-
53
-
54
-
55
-
56
-
57
-
58
-
59
-
60
-
61
-
62
-
63
-
64
-
65
-
66
-
67
-
68
-
69
-
70
-
71
-
72
-
73
-
74
-
75
-
76
-
77
-
78
-
79
-
80
-
81
-
82
-
83
-
84
-
85
-
86
-
87
-
88
-
89
-
90
-
91
-
92
-
93
-
94
-
95
-
96
-
97
-
98
-
99
-
100
-
101
-
102
-
103
-
104
-
105
-
106
-
107
-
108
-
109
-
110
-
111
-
112
-
113
-
114
-
115
-
116
-
117
-
118
-
119
-
120
-
121
-
122
-
123
-
124
-
125
-
126
-
127
-
128
-
129
-
130
-
131
-
132
-
133
-
134
-
135
-
136
-
137
-
138
-
139
-
140
-
141
-
142
-
143
-
144
-
145
-
146
-
147
-
148
-
149
-
150
-
151
-
152
-
153
-
154
-
155
-
156
-
157
-
158
-
159
-
160
-
161
-
162
-
163
-
164
-
165
-
166
-
167
-
168
-
169
-
170
-
171
-
172
-
173
-
174
-
175
-
176
-
177
-
178
-
179
-
180
-
181
-
182
-
183
-
184
-
185
-
186
-
187
-
188
-
189
-
190
-
191
-
192
-
193
-
194
-
195
-
196
-
197
-
198
-
199
-
200
-
201
-
202
-
203
-
204
-
205
-
206
-
207
-
208
-
209
-
210
-
211
-
212
-
213
-
214
-
215
-
216
-
217
-
218
-
219
-
220
-
221
-
222
-
223
-
224
-
225
-
226
-
227
-
228
-
229
-
230
-
231
-
232
-
233
-
234
-
235
-
236
-
237
-
238
-
239
-
240
-
241
-
242
-
243
-
244
-
245
-
246
-
247
-
248
-
 249
249 -
 250
250 -
 251
251 -
 252
252 -
 253
253 -
 254
254 -
 255
255 -
 256
256 -
 257
257 -
 258
258 -
 259
259 -
 260
260 -
 261
261 -
 262
262 -
 263
263 -
 264
264 -
 265
265 -
 266
266 -
 267
267 -
 268
268 -
 269
269 -
270
-
271
-
272
-
273
-
274
-
275
-
276
-
277
-
278
-
279
-
280
-
281
-
282
-
283
-
284
-
285
-
286
-
287
-
288
-
289
-
290
-
291
-
292
-
293
-
294
-
295
-
296
-
297
-
298
-
299
-
300
-
301
-
302
-
303
-
304
-
305
-
306
-
307
-
308
 |
 |

PART II
239
DUKE ENERGY CORPORATION • DUKE ENERGY CAROLINAS, LLC • PROGRESS ENERGY, INC. • CAROLINA POWER & LIGHT COMPANY d/b/a PROGRESS ENERGY
CAROLINAS, INC. • FLORIDA POWER CORPORATION d/b/a PROGRESS ENERY FLORIDA, INC. • DUKE ENERGY OHIO, INC. • DUKE ENERGY INDIANA, INC
.
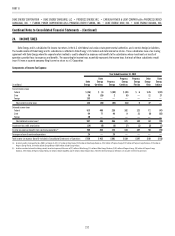
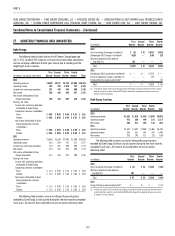
Combined Notes to Consolidated Financial Statements – (Continued)
In these condensed consolidating statements, the Progress Energy
Parent column includes the fi nancial results of the parent holding company
only. The Subsidiary Guarantor column includes the consolidated fi nancial
results of Florida Progress only, which is primarily comprised of its wholly
owned subsidiary Progress Energy Florida. The Non-Guarantor Subsidiaries
column includes the consolidated fi nancial results of all non-guarantor
subsidiaries, which is primarily comprised of Progress Energy’s wholly
owned subsidiary Progress Energy Carolinas. The Other column includes
elimination entries for all intercompany transactions and other consolidation
adjustments. Financial statements for Progress Energy Carolinas and Progress
Energy Florida are separately presented elsewhere in this Form 10-K. All
applicable corporate expenses have been allocated appropriately among the
guarantor and non-guarantor subsidiaries. The fi nancial information may not
necessarily be indicative of results of operations or fi nancial position had
the subsidiary guarantor or other non-guarantor subsidiaries operated as
independent entities.
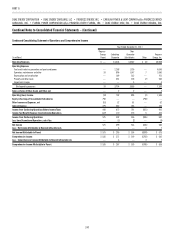
Condensed Consolidating Statement of Operations and Comprehensive Income
Year Ended December 31, 2012
(in millions)
Progress
Energy
Parent
Subsidiary
Guarantor
Non-
Guarantor
Subsidiaries Other
Progress
Energy, Inc.
Operating Revenues $ — $4,701 $4,707 $ (3) $9,405
Operating Expenses
Fuel used in electric generation and purchased power — 2,409 1,895 — 4,304
Operation, maintenance and other 4 981 1,452 8 2,445
Depreciation and amortization — 192 555 — 747
Property and other taxes — 347 232 (9) 570
Impairment charges — 146 54 — 200
Total operating expenses 4 4,075 4,188 (1) 8,266
Gains (Losses) on Sales of Other Assets and Other, net — 2 (4) — (2)
Operating (Loss) Income (4) 628 515 (2) 1,137
Equity in Earnings of Consolidated Subsidiaries 560 — — (560) —
Other Income and Expenses, net 8 42 81 (1) 130
Interest Expense 256 276 208 — 740
Income from Continuing Operations Before Income Taxes 308 394 388 (563) 527
Income Tax (Benefi t) Expense from Continuing Operations (92) 138 123 3 172
Income from Continuing Operations 400 256 265 (566) 355
Income from Discontinued Operations, net of tax — 35 17 — 52
Net Income 400 291 282 (566) 407
Less: Net Income Attributable to Noncontrolling Interests — 4 — 3 7
Net Income Attributable to Parent $400 $ 287 $ 282 $(569) $ 400
Comprehensive Income $498 $ 308 $ 352 $(653) $ 505
Less: Comprehensive Income Attributable to Noncontrolling Interests — 4 — 3 7
Comprehensive Income Attributable to Parent $ 498 $ 304 $ 352 $(656) $ 498