Duke Energy 2012 Annual Report Download - page 75
Download and view the complete annual report
Please find page 75 of the 2012 Duke Energy annual report below. You can navigate through the pages in the report by either clicking on the pages listed below, or by using the keyword search tool below to find specific information within the annual report.-
 1
1 -
2
-
3
-
4
-
5
-
6
-
7
-
8
-
9
-
10
-
11
-
12
-
13
-
14
-
15
-
16
-
17
-
18
-
19
-
20
-
21
-
22
-
23
-
24
-
25
-
26
-
27
-
28
-
29
-
30
-
31
-
32
-
33
-
34
-
35
-
36
-
37
-
38
-
39
-
40
-
41
-
42
-
43
-
44
-
45
-
46
-
47
-
48
-
49
-
50
-
51
-
52
-
53
-
54
-
55
-
56
-
57
-
58
-
59
-
60
-
61
-
62
-
63
-
64
-
 65
65 -
 66
66 -
 67
67 -
 68
68 -
 69
69 -
 70
70 -
 71
71 -
 72
72 -
 73
73 -
 74
74 -
 75
75 -
 76
76 -
 77
77 -
 78
78 -
 79
79 -
 80
80 -
 81
81 -
 82
82 -
 83
83 -
 84
84 -
 85
85 -
86
-
87
-
88
-
89
-
90
-
91
-
92
-
93
-
94
-
95
-
96
-
97
-
98
-
99
-
100
-
101
-
102
-
103
-
104
-
105
-
106
-
107
-
108
-
109
-
110
-
111
-
112
-
113
-
114
-
115
-
116
-
117
-
118
-
119
-
120
-
121
-
122
-
123
-
124
-
125
-
126
-
127
-
128
-
129
-
130
-
131
-
132
-
133
-
134
-
135
-
136
-
137
-
138
-
139
-
140
-
141
-
142
-
143
-
144
-
145
-
146
-
147
-
148
-
149
-
150
-
151
-
152
-
153
-
154
-
155
-
156
-
157
-
158
-
159
-
160
-
161
-
162
-
163
-
164
-
165
-
166
-
167
-
168
-
169
-
170
-
171
-
172
-
173
-
174
-
175
-
176
-
177
-
178
-
179
-
180
-
181
-
182
-
183
-
184
-
185
-
186
-
187
-
188
-
189
-
190
-
191
-
192
-
193
-
194
-
195
-
196
-
197
-
198
-
199
-
200
-
201
-
202
-
203
-
204
-
205
-
206
-
207
-
208
-
209
-
210
-
211
-
212
-
213
-
214
-
215
-
216
-
217
-
218
-
219
-
220
-
221
-
222
-
223
-
224
-
225
-
226
-
227
-
228
-
229
-
230
-
231
-
232
-
233
-
234
-
235
-
236
-
237
-
238
-
239
-
240
-
241
-
242
-
243
-
244
-
245
-
246
-
247
-
248
-
249
-
250
-
251
-
252
-
253
-
254
-
255
-
256
-
257
-
258
-
259
-
260
-
261
-
262
-
263
-
264
-
265
-
266
-
267
-
268
-
269
-
270
-
271
-
272
-
273
-
274
-
275
-
276
-
277
-
278
-
279
-
280
-
281
-
282
-
283
-
284
-
285
-
286
-
287
-
288
-
289
-
290
-
291
-
292
-
293
-
294
-
295
-
296
-
297
-
298
-
299
-
300
-
301
-
302
-
303
-
304
-
305
-
306
-
307
-
308
 |
 |

55
PART II
a retirement benefi t consisting of pay credits that are based upon a percentage
(which may vary with age and years of service) of current eligible earnings and
current interest credits. Certain Progress Energy and Cinergy U.S. employees
are covered under plans that use a fi nal average earnings formula. Under
the Cinergy fi nal average earnings formula, a plan participant accumulates
a retirement benefi t equal to a percentage of their highest 3-year average
earnings, plus a percentage of their highest 3-year average earnings in excess of
covered compensation per year of participation (maximum of 35 years), plus a
percentage of their highest 3-year average earnings times years of participation
in excess of 35 years. Under the Progress Energy fi nal average earnings formula,
a plan participant accumulates a retirement benefi t equal to a percentage of their
highest 4-year average earnings, plus a percentage of their highest 4-year average
earnings in excess of covered compensation per year of participation (maximum
of 35 years), plus a percentage of their highest 4-year average earnings times
years of participation in excess of 35 years. Duke Energy also maintains, and the
Subsidiary Registrants participate in, non-qualifi ed, non-contributory defi ned
benefi t retirement plans which cover certain executives.
Duke Energy and most of its subsidiaries provide, and the Subsidiary
Registrants participate in, some health care and life insurance benefi ts for
retired employees on a contributory and non-contributory basis. Certain
employees are eligible for these benefi ts if they have met age and service
requirements at retirement, as defi ned in the plans.
Duke Energy recognized pre-tax qualifi ed pension cost of $117 million in
2012. In 2013, Duke Energy’s pre-tax qualifi ed pension cost is expected to be
$61 million higher than in 2012 resulting primarily from a 2013 decrease in the
discount rate on obligations and expected long-term rate of return on assets,
and 12 months of expense recognition in 2013 for the Progress Energy plans.
Duke Energy recognized pre-tax nonqualifi ed pension cost of $19 million and
pre-tax other post-retirement benefi ts cost of $80 million, in 2012. In 2013,
pre-tax non-qualifi ed pension cost is expected to be approximately the same
amount as in 2012. In 2013, pre-tax other post-retirement benefi ts costs are
expected to be approximately $46 million higher than in 2012 resulting primarily
from 12 months of expense recognition in 2013 for the Progress Energy plans.
For both pension and other post-retirement plans, Duke Energy assumes
that its plan’s assets will generate a long-term rate of return of 7.75% as of
December 31, 2012. The assets for Duke Energy’s pension and other post-
retirement plans are maintained in two master trusts, the Duke Energy Master
Retirement Trust and the Progress Energy Master Trust. The investment objective
of the master trusts is to achieve reasonable returns on trust assets, subject
to a prudent level of portfolio risk, for the purpose of enhancing the security
of benefi ts for plan participants. The asset allocation targets were set after
considering the investment objective and the risk profi le. U.S. equities are held for
their high expected return. Non-U.S. equities, debt securities, hedge funds, real
estate and other global securities are held for diversifi cation. Investments within
asset classes are to be diversifi ed to achieve broad market participation and
reduce the impact of individual managers on investments. Duke Energy regularly
reviews its actual asset allocation and periodically rebalances its investments
to its targeted allocation when considered appropriate. Duke Energy also invests
other post-retirement assets in the Duke Energy Corporation Employee Benefi ts
Trust (VEBA I). The investment objective of VEBA I is to achieve suffi cient returns,
subject to a prudent level of portfolio risk, for the purpose of promoting the
security of plan benefi ts for participants. VEBA I is passively managed.
The expected long-term rate of return of 7.75% for the plan’s assets was
developed using a weighted average calculation of expected returns for the
master trusts based primarily on future expected returns across asset classes
considering the use of active asset managers. The weighted average returns
expected by asset classes for the Duke Energy Retirement Master Trust were
2.53% for U.S. equities, 1.46% for Non-U.S. equities, 0.97% for global equities,
1.65% for debt securities, 0.36% for global private equity, 0.22% for hedge
funds, 0.28% for real estate and 0.28% for other global securities. The weighted
average returns expected by asset classes for the Progress Energy Master Trust
were 1.83% for U.S. equities, 1.41% for Non-U.S. equities, 0.78% for global
equities, 1.67% for debt securities, 1.20% for global private equity, 0.57% for
hedge funds, 0.08% for real estate and 0.21% for other global securities.
Duke Energy discounted its future U.S. pension and other
post-retirement obligations using a rate of 4.1% as of December 31,
2012. The discount rates used to measure benefi t plan benefi t obligations
for fi nancial reporting purposes should refl ect rates at which pension
benefi ts could be effectively settled. As of December 31, 2012, Duke Energy
determined its discount rate for U.S. pension and other post-retirement
obligations using a bond selection-settlement portfolio approach. This
approach develops a discount rate by selecting a portfolio of high quality
corporate bonds that generate suffi cient cash fl ow to provide for the projected
benefi t payments of the plan. The selected bond portfolio is derived from a
universe of non-callable corporate bonds rated Aa quality or higher. After the
bond portfolio is selected, a single interest rate is determined that equates the
present value of the plan’s projected benefi t payments discounted at this rate
with the market value of the bonds selected.
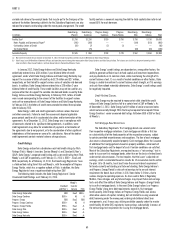
Future changes in plan asset returns, assumed discount rates and various
other factors related to the participants in Duke Energy’s pension and
post-retirement plans will impact Duke Energy’s future pension expense and
liabilities. Management cannot predict with certainty what these factors will
be in the future. The following table presents the approximate effect on Duke
Energy’s 2012 pre-tax pension expense, pension obligation and other post-
retirement benefi t obligation if a 0.25% change in rates were to occur.
Qualifi ed and Non-
Qualifi ed Pension Plans Other Post-retirement Plans
(in millions) +0.25% -0.25% +0.25% -0.25%
Effect on 2012 pre-tax pension expense
Expected long-term rate of return $ (12) $ 12 $— $—
Discount rate (8) 8 (1) 1
Effect on benefi t obligation at December 31, 2012
Discount rate $(123) $127 $(15) $ 16
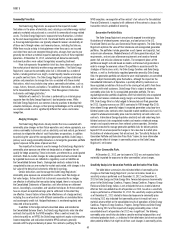
Duke Energy’s U.S. post-retirement plan uses a medical care trend rate which refl ects the near and long-term expectation of increases in medical health care costs.
Duke Energy’s U.S. post-retirement plan uses a prescription drug trend rate which refl ects the near and long-term expectation of increases in prescription drug health care
costs. As of December 31, 2012, the medical care trend rates were 8.5%, which grades to 5.00% by 2020. The following table presents the approximate effect on Duke
Energy’s 2012 pre-tax other post-retirement expense and other post-retirement benefi t obligation if a 1% point change in the health care trend rate were to occur.
Other Post-retirement Plans
(in millions) +1.0% -1.0%
Effect on 2012 other post-retirement expense $ 9 $ (7)
Effect on other post-retirement benefi t obligation at December 31, 2012 164 (133)