Duke Energy 2012 Annual Report Download - page 132
Download and view the complete annual report
Please find page 132 of the 2012 Duke Energy annual report below. You can navigate through the pages in the report by either clicking on the pages listed below, or by using the keyword search tool below to find specific information within the annual report.-
 1
1 -
2
-
3
-
4
-
5
-
6
-
7
-
8
-
9
-
10
-
11
-
12
-
13
-
14
-
15
-
16
-
17
-
18
-
19
-
20
-
21
-
22
-
23
-
24
-
25
-
26
-
27
-
28
-
29
-
30
-
31
-
32
-
33
-
34
-
35
-
36
-
37
-
38
-
39
-
40
-
41
-
42
-
43
-
44
-
45
-
46
-
47
-
48
-
49
-
50
-
51
-
52
-
53
-
54
-
55
-
56
-
57
-
58
-
59
-
60
-
61
-
62
-
63
-
64
-
65
-
66
-
67
-
68
-
69
-
70
-
71
-
72
-
73
-
74
-
75
-
76
-
77
-
78
-
79
-
80
-
81
-
82
-
83
-
84
-
85
-
86
-
87
-
88
-
89
-
90
-
91
-
92
-
93
-
94
-
95
-
96
-
97
-
98
-
99
-
100
-
101
-
102
-
103
-
104
-
105
-
106
-
107
-
108
-
109
-
110
-
111
-
112
-
113
-
114
-
115
-
116
-
117
-
118
-
119
-
120
-
121
-
 122
122 -
 123
123 -
 124
124 -
 125
125 -
 126
126 -
 127
127 -
 128
128 -
 129
129 -
 130
130 -
 131
131 -
 132
132 -
 133
133 -
 134
134 -
 135
135 -
 136
136 -
 137
137 -
 138
138 -
 139
139 -
 140
140 -
 141
141 -
 142
142 -
143
-
144
-
145
-
146
-
147
-
148
-
149
-
150
-
151
-
152
-
153
-
154
-
155
-
156
-
157
-
158
-
159
-
160
-
161
-
162
-
163
-
164
-
165
-
166
-
167
-
168
-
169
-
170
-
171
-
172
-
173
-
174
-
175
-
176
-
177
-
178
-
179
-
180
-
181
-
182
-
183
-
184
-
185
-
186
-
187
-
188
-
189
-
190
-
191
-
192
-
193
-
194
-
195
-
196
-
197
-
198
-
199
-
200
-
201
-
202
-
203
-
204
-
205
-
206
-
207
-
208
-
209
-
210
-
211
-
212
-
213
-
214
-
215
-
216
-
217
-
218
-
219
-
220
-
221
-
222
-
223
-
224
-
225
-
226
-
227
-
228
-
229
-
230
-
231
-
232
-
233
-
234
-
235
-
236
-
237
-
238
-
239
-
240
-
241
-
242
-
243
-
244
-
245
-
246
-
247
-
248
-
249
-
250
-
251
-
252
-
253
-
254
-
255
-
256
-
257
-
258
-
259
-
260
-
261
-
262
-
263
-
264
-
265
-
266
-
267
-
268
-
269
-
270
-
271
-
272
-
273
-
274
-
275
-
276
-
277
-
278
-
279
-
280
-
281
-
282
-
283
-
284
-
285
-
286
-
287
-
288
-
289
-
290
-
291
-
292
-
293
-
294
-
295
-
296
-
297
-
298
-
299
-
300
-
301
-
302
-
303
-
304
-
305
-
306
-
307
-
308
 |
 |

112
PART II
Combined Notes to Consolidated Financial Statements – (Continued)
DUKE ENERGY CORPORATION • DUKE ENERGY CAROLINAS, LLC • PROGRESS ENERGY, INC. • CAROLINA POWER & LIGHT COMPANY d/b/a PROGRESS ENERGY
CAROLINAS, INC. • FLORIDA POWER CORPORATION d/b/a PROGRESS ENERY FLORIDA, INC. • DUKE ENERGY OHIO, INC. • DUKE ENERGY INDIANA, INC.
date nor the merger resulted in any changes to the Progress Energy reporting
units. Due to signifi cant judgments and estimates that are utilized in a goodwill
impairment analysis, Progress Energy determined it was impracticable to
objectively determine, without the use of hindsight, projected cash fl ows and
related valuation estimates as of each August 31, for periods prior to August 31,
2012. As such, the change in the annual goodwill impairment testing date was
prospectively applied from August 31, 2012.
Duke Energy, Progress Energy and Duke Energy Ohio perform the annual
review for goodwill impairment at the reporting unit level, which Duke Energy
and Progress Energy have determined to be an operating segment or one
level below and which Duke Energy Ohio has determined to be an operating
segment.
The annual goodwill impairment test may fi rst consider qualitative factors
to determine whether it is more likely than not (i.e. greater than 50 percent
chance) that the fair value of a reporting unit is less than its book value. This
is sometimes referred to as “step zero” and is an optional step in the annual
goodwill impairment analysis (see further discussion as discussed in “New
Accounting Standards” below). If the results of qualitative assessments indicate
that the fair value of a reporting unit is more likely than not less than the
carrying value of the reporting unit, the two-step impairment test is required.
Step one of the impairment test involves comparing the fair values of reporting
units with their carrying values, including goodwill. If the carrying amount is
less than fair value in step one, further testing of goodwill is not performed. If
the carrying amount of a reporting unit exceeds the reporting unit’s fair value,
step two must be performed to determine the amount, if any, of the goodwill
impairment loss. Step two of the goodwill impairment test involves comparing
the implied fair value of the reporting unit’s goodwill against the carrying value
of the goodwill. Under step two, determining the implied fair value of goodwill
requires the valuation of a reporting unit’s identifi able tangible and intangible
assets and liabilities as if the reporting unit had been acquired in a business
combination on the testing date. The difference between the fair value of the
entire reporting unit as determined in step one and the net fair value of all
identifi able assets and liabilities represents the implied fair value of goodwill.
The goodwill impairment charge, if any, would be the excess of the carrying
amount of goodwill over the implied fair value of goodwill upon the completion
of step two.
As a result of the Progress Energy merger, Duke Energy, Progress Energy
and Duke Energy Ohio performed step one of the goodwill impairment test as of
August 31, 2012, and concluded the fair value of the reporting units exceeded
their respective carrying values, and thus, did not record any impairment
charges. In 2011, Duke Energy and Duke Energy Ohio performed the qualitative
assessments under step zero and concluded that it was more likely than not the
fair value of each reporting unit exceeded its carrying value. In 2011, Progress
Energy performed step one of the goodwill impairment test, which indicated the
carrying amounts of goodwill were not impaired. In 2010, Duke Energy, Progress
Energy and Duke Energy Ohio used the two-step process to test goodwill for
impairment, which resulted in impairments recorded by Duke Energy and Duke
Energy Ohio.
See Note 12 for further information.
Long-Lived Asset Impairments.
The Duke Energy Registrants evaluate whether long-lived assets,
excluding goodwill, have been impaired when circumstances indicate the
carrying value of those assets may not be recoverable. For such long-lived
assets, an impairment exists when its carrying value exceeds the sum of
estimates of the undiscounted cash fl ows expected to result from the use and
eventual disposition of the asset. When alternative courses of action to recover
the carrying amount of a long-lived asset are under consideration, a probability-
weighted approach is used for developing estimates of future undiscounted
cash fl ows. If the carrying value of the long-lived asset is not recoverable based
on these estimated future undiscounted cash fl ows, the impairment loss is
measured as the excess of the carrying value of the asset over its fair value,
such that the asset’s carrying value is adjusted to its estimated fair value.
Management assesses the fair value of long-lived assets using commonly
accepted techniques, and may use more than one source. Sources to determine
fair value include, but are not limited to, recent third -party comparable sales,
internally developed discounted cash fl ow analysis and analysis from outside
advisors. Signifi cant changes in market conditions resulting from events such
as, among others, changes in commodity prices or the condition of an asset,
or a change in management’s intent to utilize the asset are generally viewed
by management as triggering events to re-assess the cash fl ows related to the
long-lived assets.
See Note 12 for further information.
Property, Plant and Equipment.
Property, plant and equipment are stated at the lower of historical cost less
accumulated depreciation or fair value, if impaired. The Duke Energy Registrants
capitalize all construction-related direct labor and material costs, as well as
indirect construction costs. Indirect costs include general engineering, taxes and
the allowance for funds used during construction (AFUDC). See “AFUDC and
Interest Capitalized,” below for additional information. The cost of renewals
and betterments that extend the useful life of property, plant and equipment
are also capitalized. The cost of repairs, replacements and major maintenance
projects, which do not extend the useful life or increase the expected output of
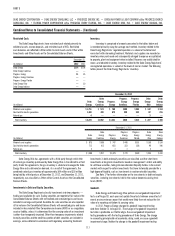
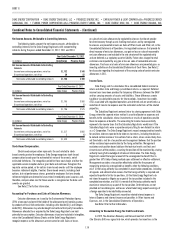
the asset, are expensed as incurred. Depreciation is generally computed over the
estimated useful life of the asset using the composite straight-line method. For
regulated operations, depreciation studies are conducted periodically to update
the composite rates and are approved by the various state commissions. The
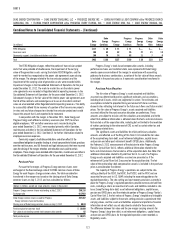
composite weighted-average depreciation rates, excluding nuclear fuel, for each
of the Duke Energy Registrants are included in the following table:
Years Ended December 31,
(percentages) 2012 2011 2010
Duke Energy 2.9 3.2 3.2
Duke Energy Carolinas 2.8 2.6 2.7
Progress Energy 2.6 2.3 2.0
Progress Energy Carolinas 2.7 2.1 2.1
Progress Energy Florida 2.5 2.4 1.9
Duke Energy Ohio 3.2 3.5 4.1
Duke Energy Indiana 3.3 3.4 3.5
When the Duke Energy Registrants retire regulated property, plant and
equipment under what is considered a normal retirement, the original cost
plus the cost of retirement, less salvage value, is charged to accumulated
depreciation, consistent with regulated rate-making practices. When it becomes
probable that a regulated generation asset will be retired substantially in
advance of its original expected useful life or is abandoned, the cost of the
asset and the corresponding accumulated depreciation is removed from
Cost and Accumulated depreciation and amortization within Property, Plant
and Equipment on the Consolidated Balance Sheets and a separate asset
is recognized. If the plant is still in operation, the amount is classifi ed as
Generation facilities to be retired, net on the Consolidated Balance Sheets. If the
plant is no longer operating, then a regulatory asset is recognized. The carrying
value of the asset is based on historical cost if the Duke Energy Registrants are