Duke Energy 2012 Annual Report Download - page 255
Download and view the complete annual report
Please find page 255 of the 2012 Duke Energy annual report below. You can navigate through the pages in the report by either clicking on the pages listed below, or by using the keyword search tool below to find specific information within the annual report.-
 1
1 -
2
-
3
-
4
-
5
-
6
-
7
-
8
-
9
-
10
-
11
-
12
-
13
-
14
-
15
-
16
-
17
-
18
-
19
-
20
-
21
-
22
-
23
-
24
-
25
-
26
-
27
-
28
-
29
-
30
-
31
-
32
-
33
-
34
-
35
-
36
-
37
-
38
-
39
-
40
-
41
-
42
-
43
-
44
-
45
-
46
-
47
-
48
-
49
-
50
-
51
-
52
-
53
-
54
-
55
-
56
-
57
-
58
-
59
-
60
-
61
-
62
-
63
-
64
-
65
-
66
-
67
-
68
-
69
-
70
-
71
-
72
-
73
-
74
-
75
-
76
-
77
-
78
-
79
-
80
-
81
-
82
-
83
-
84
-
85
-
86
-
87
-
88
-
89
-
90
-
91
-
92
-
93
-
94
-
95
-
96
-
97
-
98
-
99
-
100
-
101
-
102
-
103
-
104
-
105
-
106
-
107
-
108
-
109
-
110
-
111
-
112
-
113
-
114
-
115
-
116
-
117
-
118
-
119
-
120
-
121
-
122
-
123
-
124
-
125
-
126
-
127
-
128
-
129
-
130
-
131
-
132
-
133
-
134
-
135
-
136
-
137
-
138
-
139
-
140
-
141
-
142
-
143
-
144
-
145
-
146
-
147
-
148
-
149
-
150
-
151
-
152
-
153
-
154
-
155
-
156
-
157
-
158
-
159
-
160
-
161
-
162
-
163
-
164
-
165
-
166
-
167
-
168
-
169
-
170
-
171
-
172
-
173
-
174
-
175
-
176
-
177
-
178
-
179
-
180
-
181
-
182
-
183
-
184
-
185
-
186
-
187
-
188
-
189
-
190
-
191
-
192
-
193
-
194
-
195
-
196
-
197
-
198
-
199
-
200
-
201
-
202
-
203
-
204
-
205
-
206
-
207
-
208
-
209
-
210
-
211
-
212
-
213
-
214
-
215
-
216
-
217
-
218
-
219
-
220
-
221
-
222
-
223
-
224
-
225
-
226
-
227
-
228
-
229
-
230
-
231
-
232
-
233
-
234
-
235
-
236
-
237
-
238
-
239
-
240
-
241
-
242
-
243
-
244
-
 245
245 -
 246
246 -
 247
247 -
 248
248 -
 249
249 -
 250
250 -
 251
251 -
 252
252 -
 253
253 -
 254
254 -
 255
255 -
 256
256 -
 257
257 -
 258
258 -
 259
259 -
 260
260 -
 261
261 -
 262
262 -
 263
263 -
 264
264 -
 265
265 -
266
-
267
-
268
-
269
-
270
-
271
-
272
-
273
-
274
-
275
-
276
-
277
-
278
-
279
-
280
-
281
-
282
-
283
-
284
-
285
-
286
-
287
-
288
-
289
-
290
-
291
-
292
-
293
-
294
-
295
-
296
-
297
-
298
-
299
-
300
-
301
-
302
-
303
-
304
-
305
-
306
-
307
-
308
 |
 |

PART II
235
DUKE ENERGY CORPORATION • DUKE ENERGY CAROLINAS, LLC • PROGRESS ENERGY, INC. • CAROLINA POWER & LIGHT COMPANY d/b/a PROGRESS ENERGY
CAROLINAS, INC. • FLORIDA POWER CORPORATION d/b/a PROGRESS ENERY FLORIDA, INC. • DUKE ENERGY OHIO, INC. • DUKE ENERGY INDIANA, INC
.
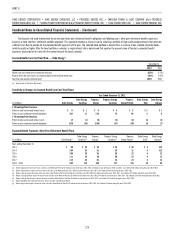
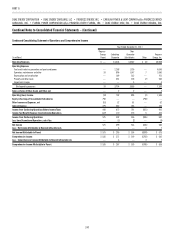
Combined Notes to Consolidated Financial Statements – (Continued)
Valuation allowances have been established for certain foreign and state net operating loss carryforwards that reduce deferred tax assets to an amount that will
be realized on a more-likely-than-not basis. The net change in the total valuation allowance is included in Tax differential on foreign earnings and State income tax,
net of federal income tax effect in the above tables.
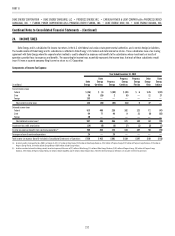
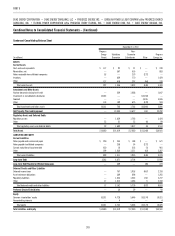
Net Deferred Income Tax Liability Components
December 31, 2012
(in millions)
Duke
Energy
Duke
Energy
Carolinas
Progress
Energy
Progress
Energy
Carolinas
Progress
Energy
Florida
Duke
Energy
Ohio
Duke
Energy
Indiana
Deferred credits and other liabilities $ 2,948 $ 194 $ 822 $ 342 $ 333 $ 52 $ 115
Tax credits and NOL carryforwards 3,311 447 1,536 309 91 152 340
Other 408 22 230 82 126 10 27
Valuation allowance (226) — (77) — — (1) —
Total deferred income tax assets 6,441 663 2,511 733 550 213 482
Investments and other assets (1,093) (838) (112) (108) (6) (25) (18)
Accelerated depreciation rates (11,208) (4,289) (2,803) (2,178) (592) (1,823) (1,131)
Regulatory assets and deferred debits (3,819) (627) (1,775) (465) (1,318) (197) (185)
Total deferred income tax liabilities (16,120) (5,754) (4,690) (2,751) (1,916) (2,045) (1,334)
Net deferred income tax liabilities $ (9,679) $(5,091) $(2,179) $(2,018) $(1,366) $(1,832) $ (852)
The following table presents the expiration of tax credits and NOL carryforwards.
December 31, 2012
(in millions) Amount Expiration year
Investment Tax Credits $ 391 2029 — 2032
Alternative Minimum Tax Credits 1,033 Indefi nite
Federal NOL carryforwards 1,604 2031 — 2032
State NOL carryforwards(a) 166 2013 — 2032
Foreign NOL carryforwards(b) 117 2015 — 2032; Indefi nite
Total tax credits and NOL carryforwards $3,311
(a) A valuation allowance of $121 million has been recorded on the state NOL carryforwards and state capital loss carryforwards, as presented in the Net Deferred Income Tax Liability Components table.
(b) A valuation allowance of $105 million has been recorded on the foreign NOL carryforwards, as presented in the Net Deferred Income Tax Liability Components table.
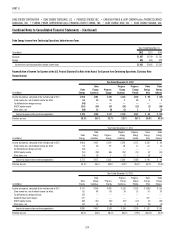
December 31, 2011
(in millions)
Duke
Energy
Duke
Energy
Carolinas
Progress
Energy
Progress
Energy
Carolinas
Progress
Energy
Florida
Duke
Energy
Ohio
Duke
Energy
Indiana
Deferred credits and other liabilities $ 790 $ 228 $ 900 $ 441 $ 513 $ 68 $ 92
Tax credits and NOL carryforwards 930 199 1,163 57 42 — 95
Regulatory liabilities and deferred credits — — 375 142 198 — —
Investments and other assets — — — — — 3 —
Other 137 18 522 168 101 31 5
Valuation allowance (144) — (71) — — — —
Total deferred income tax assets 1,713 445 2,889 808 854 102 192
Investments and other assets (809) (720) — (103) (56) — (2)
Accelerated depreciation rates (6,989) (3,576) (3,098) (1,908) (1,180) (1,706) (968)
Regulatory assets and deferred debits (1,219) (658) (1,271) (541) (685) (216) (136)
Other — — (315) (17) (120) — —
Total deferred income tax liabilities (9,017) (4,954) (4,684) (2,569) (2,041) (1,922) (1,106)
Net deferred income tax liabilities $(7,304) $(4,509) $(1,795) $(1,761) $(1,187) $(1,820) $ (914)