Duke Energy 2012 Annual Report Download - page 264
Download and view the complete annual report
Please find page 264 of the 2012 Duke Energy annual report below. You can navigate through the pages in the report by either clicking on the pages listed below, or by using the keyword search tool below to find specific information within the annual report.-
 1
1 -
2
-
3
-
4
-
5
-
6
-
7
-
8
-
9
-
10
-
11
-
12
-
13
-
14
-
15
-
16
-
17
-
18
-
19
-
20
-
21
-
22
-
23
-
24
-
25
-
26
-
27
-
28
-
29
-
30
-
31
-
32
-
33
-
34
-
35
-
36
-
37
-
38
-
39
-
40
-
41
-
42
-
43
-
44
-
45
-
46
-
47
-
48
-
49
-
50
-
51
-
52
-
53
-
54
-
55
-
56
-
57
-
58
-
59
-
60
-
61
-
62
-
63
-
64
-
65
-
66
-
67
-
68
-
69
-
70
-
71
-
72
-
73
-
74
-
75
-
76
-
77
-
78
-
79
-
80
-
81
-
82
-
83
-
84
-
85
-
86
-
87
-
88
-
89
-
90
-
91
-
92
-
93
-
94
-
95
-
96
-
97
-
98
-
99
-
100
-
101
-
102
-
103
-
104
-
105
-
106
-
107
-
108
-
109
-
110
-
111
-
112
-
113
-
114
-
115
-
116
-
117
-
118
-
119
-
120
-
121
-
122
-
123
-
124
-
125
-
126
-
127
-
128
-
129
-
130
-
131
-
132
-
133
-
134
-
135
-
136
-
137
-
138
-
139
-
140
-
141
-
142
-
143
-
144
-
145
-
146
-
147
-
148
-
149
-
150
-
151
-
152
-
153
-
154
-
155
-
156
-
157
-
158
-
159
-
160
-
161
-
162
-
163
-
164
-
165
-
166
-
167
-
168
-
169
-
170
-
171
-
172
-
173
-
174
-
175
-
176
-
177
-
178
-
179
-
180
-
181
-
182
-
183
-
184
-
185
-
186
-
187
-
188
-
189
-
190
-
191
-
192
-
193
-
194
-
195
-
196
-
197
-
198
-
199
-
200
-
201
-
202
-
203
-
204
-
205
-
206
-
207
-
208
-
209
-
210
-
211
-
212
-
213
-
214
-
215
-
216
-
217
-
218
-
219
-
220
-
221
-
222
-
223
-
224
-
225
-
226
-
227
-
228
-
229
-
230
-
231
-
232
-
233
-
234
-
235
-
236
-
237
-
238
-
239
-
240
-
241
-
242
-
243
-
244
-
245
-
246
-
247
-
248
-
249
-
250
-
251
-
252
-
253
-
 254
254 -
 255
255 -
 256
256 -
 257
257 -
 258
258 -
 259
259 -
 260
260 -
 261
261 -
 262
262 -
 263
263 -
 264
264 -
 265
265 -
 266
266 -
 267
267 -
 268
268 -
 269
269 -
 270
270 -
 271
271 -
 272
272 -
 273
273 -
 274
274 -
275
-
276
-
277
-
278
-
279
-
280
-
281
-
282
-
283
-
284
-
285
-
286
-
287
-
288
-
289
-
290
-
291
-
292
-
293
-
294
-
295
-
296
-
297
-
298
-
299
-
300
-
301
-
302
-
303
-
304
-
305
-
306
-
307
-
308
 |
 |

PART II
244
DUKE ENERGY CORPORATION • DUKE ENERGY CAROLINAS, LLC • PROGRESS ENERGY, INC. • CAROLINA POWER & LIGHT COMPANY d/b/a PROGRESS ENERGY
CAROLINAS, INC. • FLORIDA POWER CORPORATION d/b/a PROGRESS ENERY FLORIDA, INC. • DUKE ENERGY OHIO, INC. • DUKE ENERGY INDIANA, INC.
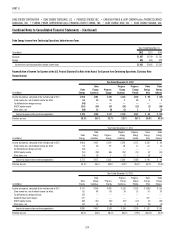
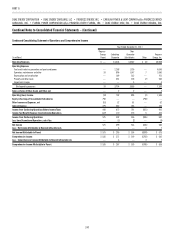
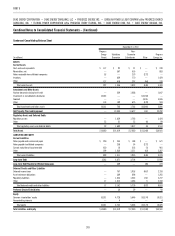
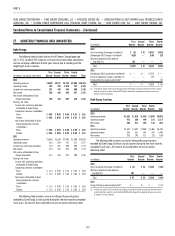
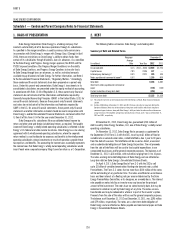
Combined Notes to Consolidated Financial Statements – (Continued)
Condensed Consolidating Statement of Cash Flows
Year Ended December 31, 2012
(in millions)
Progress
Energy
Parent
Subsidiary
Guarantor
Non-
Guarantor
Subsidiaries Other
Progress
Energy, Inc.
Net cash provided by operating activities $ 327 $ 853 $ 1,143 $(483) $ 1,840
CASH FLOWS FROM INVESTING ACTIVITIES
Capital expenditures — (809) (1,557) — (2,366)
Purchases of available-for-sale securities — (792) (582) — (1,374)
Proceeds from sales and maturities of available-for-sale securities — 792 532 1 1,325
Notes receivable from affi liated companies (550) (223) 56 717 —
Other 25 18 92 (2) 133
Net cash used by investing activities (525) (1,014) (1,459) 716 (2,282)
CASH FLOWS FROM FINANCING ACTIVITIES
Proceeds from the:
Issuance of long-term debt 444 642 988 — 2,074
Issuance of common stock 6 — — — 6
Payments for the redemption of long-term debt (450) (10) (502) — (962)
Notes payable and commercial paper (250) (233) (188) — (671)
Distributions to noncontrolling interests — (4) — (3) (7)
Dividends paid (445) — — — (445)
Distributions to parent — (173) (310) 483 —
Notes payable to affi liated companies 840 (3) 334 (716) 455
Other (1) (1) (8) 3 (7)
Net cash provided by fi nancing activities 144 218 314 (233) 443
Net (decrease) increase in cash and cash equivalents (54) 57 (2) — 1
Cash and cash equivalents at beginning of period 117 92 21 — 230
Cash and cash equivalents at end of period $ 63 $ 149 $ 19 $ — $ 231