Duke Energy 2012 Annual Report Download - page 211
Download and view the complete annual report
Please find page 211 of the 2012 Duke Energy annual report below. You can navigate through the pages in the report by either clicking on the pages listed below, or by using the keyword search tool below to find specific information within the annual report.-
 1
1 -
2
-
3
-
4
-
5
-
6
-
7
-
8
-
9
-
10
-
11
-
12
-
13
-
14
-
15
-
16
-
17
-
18
-
19
-
20
-
21
-
22
-
23
-
24
-
25
-
26
-
27
-
28
-
29
-
30
-
31
-
32
-
33
-
34
-
35
-
36
-
37
-
38
-
39
-
40
-
41
-
42
-
43
-
44
-
45
-
46
-
47
-
48
-
49
-
50
-
51
-
52
-
53
-
54
-
55
-
56
-
57
-
58
-
59
-
60
-
61
-
62
-
63
-
64
-
65
-
66
-
67
-
68
-
69
-
70
-
71
-
72
-
73
-
74
-
75
-
76
-
77
-
78
-
79
-
80
-
81
-
82
-
83
-
84
-
85
-
86
-
87
-
88
-
89
-
90
-
91
-
92
-
93
-
94
-
95
-
96
-
97
-
98
-
99
-
100
-
101
-
102
-
103
-
104
-
105
-
106
-
107
-
108
-
109
-
110
-
111
-
112
-
113
-
114
-
115
-
116
-
117
-
118
-
119
-
120
-
121
-
122
-
123
-
124
-
125
-
126
-
127
-
128
-
129
-
130
-
131
-
132
-
133
-
134
-
135
-
136
-
137
-
138
-
139
-
140
-
141
-
142
-
143
-
144
-
145
-
146
-
147
-
148
-
149
-
150
-
151
-
152
-
153
-
154
-
155
-
156
-
157
-
158
-
159
-
160
-
161
-
162
-
163
-
164
-
165
-
166
-
167
-
168
-
169
-
170
-
171
-
172
-
173
-
174
-
175
-
176
-
177
-
178
-
179
-
180
-
181
-
182
-
183
-
184
-
185
-
186
-
187
-
188
-
189
-
190
-
191
-
192
-
193
-
194
-
195
-
196
-
197
-
198
-
199
-
200
-
 201
201 -
 202
202 -
 203
203 -
 204
204 -
 205
205 -
 206
206 -
 207
207 -
 208
208 -
 209
209 -
 210
210 -
 211
211 -
 212
212 -
 213
213 -
 214
214 -
 215
215 -
 216
216 -
 217
217 -
 218
218 -
 219
219 -
 220
220 -
 221
221 -
222
-
223
-
224
-
225
-
226
-
227
-
228
-
229
-
230
-
231
-
232
-
233
-
234
-
235
-
236
-
237
-
238
-
239
-
240
-
241
-
242
-
243
-
244
-
245
-
246
-
247
-
248
-
249
-
250
-
251
-
252
-
253
-
254
-
255
-
256
-
257
-
258
-
259
-
260
-
261
-
262
-
263
-
264
-
265
-
266
-
267
-
268
-
269
-
270
-
271
-
272
-
273
-
274
-
275
-
276
-
277
-
278
-
279
-
280
-
281
-
282
-
283
-
284
-
285
-
286
-
287
-
288
-
289
-
290
-
291
-
292
-
293
-
294
-
295
-
296
-
297
-
298
-
299
-
300
-
301
-
302
-
303
-
304
-
305
-
306
-
307
-
308
 |
 |

191
PART II
DUKE ENERGY CORPORATION • DUKE ENERGY CAROLINAS, LLC • PROGRESS ENERGY, INC. • CAROLINA POWER & LIGHT COMPANY d/b/a PROGRESS ENERGY
CAROLINAS, INC. • FLORIDA POWER CORPORATION d/b/a PROGRESS ENERY FLORIDA, INC. • DUKE ENERGY OHIO, INC. • DUKE ENERGY INDIANA, INC.
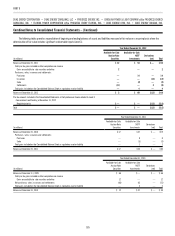
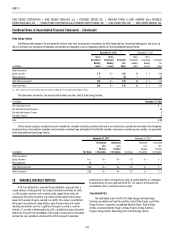
Combined Notes to Consolidated Financial Statements – (Continued)
Year Ended December 31, 2011
(in millions)
Derivatives
(net)
Balance at December 31, 2010 $4
Total pre-tax realized or unrealized gains (losses) included in earnings:
Regulated electric 14
Purchases, sales, issuances and settlements:
Purchases 8
Settlements (21)
Total losses included on the Consolidated Balance Sheet as regulatory asset or liability (1)
Balance at December 31, 2011 $4
Year Ended December 31, 2010
(in millions)
Derivatives
(net)
Balance at December 31, 2009 $4
Net, purchases, sales, issuances and settlements: (15)
Total gains included on the Consolidated Balance Sheet as regulatory asset or liability 15
Balance at December 31, 2010 $4
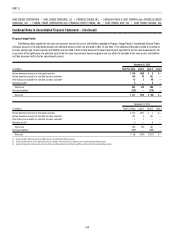
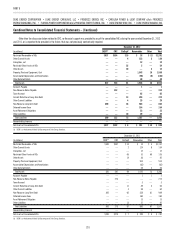
The following table includes quantitative information about the Duke Energy Registrants’ derivatives classifi ed as Level 3.
December 31, 2012
Investment Type
Fair Value
(in millions) Valuation Technique Unobservable Input Range
Duke Energy
Commodity natural gas contracts $(53) Discounted cash fl ow Forward natural gas curves — price per MMBtu $ 2.33 —$ 9.99
FERC mitigation power sale agreements $(23) Discounted cash fl ow Forward electricity curves — price per MWh $25.83 —$ 48.69
Financial transmission rights (FTRs) $ 11 RTO market pricing FTR price $23.63 —$ 39.22
Commodity power contracts $ (8) Discounted cash fl ow Forward electricity curves — price per MWh $24.82 —$ 77.96
Commodity capacity contracts $ (3) Discounted cash fl ow Forward capacity curves — price per MW day $95.16 —$105.36
Commodity capacity option contracts $ 3 Discounted cash fl ow Forward capacity option curves — price per MW day $ 4.68 —$ 77.96
Reserves $(12) Bid-ask spreads, implied volatility, probability of default
Duke Energy Carolinas
FERC mitigation power sale agreements $(12) Discounted cash fl ow Forward electricity curves — price per MWh $25.83 —$ 48.69
Progress Energy
Commodity natural gas contracts $(27) Discounted cash fl ow Forward natural gas curves — price per MMBtu $ 4.07 —$ 4.45
FERC mitigation power sale agreements $(11) Discounted cash fl ow Forward electricity curves — price per MWh $25.83 —$ 48.69
Progress Energy Carolinas
Commodity natural gas contracts $(27) Discounted cash fl ow Forward natural gas curves — price per MMBtu $ 4.07 —$ 4.45
FERC mitigation power sale agreements $(11) Discounted cash fl ow Forward electricity curves — price per MWh $25.83 —$ 48.69
Duke Energy Ohio
Financial transmission rights (FTRs) $ 1 RTO market pricing FTR price $27.17 —$ 39.22
Commodity power contracts $ (1) Discounted cash fl ow Forward electricity curves — price per MWh $25.90 —$ 57.50
Commodity natural gas contracts $ 5 Discounted cash fl ow Forward natural gas curves — price per MMBtu $ 3.30 —$ 4.51
Reserves $(11) Bid-ask spreads, implied volatility, probability of default
Duke Energy Indiana
Financial transmission rights (FTRs) $ 10 RTO market pricing FTR price $23.63 —$ 35.43