Duke Energy 2012 Annual Report Download - page 59
Download and view the complete annual report
Please find page 59 of the 2012 Duke Energy annual report below. You can navigate through the pages in the report by either clicking on the pages listed below, or by using the keyword search tool below to find specific information within the annual report.-
 1
1 -
2
-
3
-
4
-
5
-
6
-
7
-
8
-
9
-
10
-
11
-
12
-
13
-
14
-
15
-
16
-
17
-
18
-
19
-
20
-
21
-
22
-
23
-
24
-
25
-
26
-
27
-
28
-
29
-
30
-
31
-
32
-
33
-
34
-
35
-
36
-
37
-
38
-
39
-
40
-
41
-
42
-
43
-
44
-
45
-
46
-
47
-
48
-
 49
49 -
 50
50 -
 51
51 -
 52
52 -
 53
53 -
 54
54 -
 55
55 -
 56
56 -
 57
57 -
 58
58 -
 59
59 -
 60
60 -
 61
61 -
 62
62 -
 63
63 -
 64
64 -
 65
65 -
 66
66 -
 67
67 -
 68
68 -
 69
69 -
70
-
71
-
72
-
73
-
74
-
75
-
76
-
77
-
78
-
79
-
80
-
81
-
82
-
83
-
84
-
85
-
86
-
87
-
88
-
89
-
90
-
91
-
92
-
93
-
94
-
95
-
96
-
97
-
98
-
99
-
100
-
101
-
102
-
103
-
104
-
105
-
106
-
107
-
108
-
109
-
110
-
111
-
112
-
113
-
114
-
115
-
116
-
117
-
118
-
119
-
120
-
121
-
122
-
123
-
124
-
125
-
126
-
127
-
128
-
129
-
130
-
131
-
132
-
133
-
134
-
135
-
136
-
137
-
138
-
139
-
140
-
141
-
142
-
143
-
144
-
145
-
146
-
147
-
148
-
149
-
150
-
151
-
152
-
153
-
154
-
155
-
156
-
157
-
158
-
159
-
160
-
161
-
162
-
163
-
164
-
165
-
166
-
167
-
168
-
169
-
170
-
171
-
172
-
173
-
174
-
175
-
176
-
177
-
178
-
179
-
180
-
181
-
182
-
183
-
184
-
185
-
186
-
187
-
188
-
189
-
190
-
191
-
192
-
193
-
194
-
195
-
196
-
197
-
198
-
199
-
200
-
201
-
202
-
203
-
204
-
205
-
206
-
207
-
208
-
209
-
210
-
211
-
212
-
213
-
214
-
215
-
216
-
217
-
218
-
219
-
220
-
221
-
222
-
223
-
224
-
225
-
226
-
227
-
228
-
229
-
230
-
231
-
232
-
233
-
234
-
235
-
236
-
237
-
238
-
239
-
240
-
241
-
242
-
243
-
244
-
245
-
246
-
247
-
248
-
249
-
250
-
251
-
252
-
253
-
254
-
255
-
256
-
257
-
258
-
259
-
260
-
261
-
262
-
263
-
264
-
265
-
266
-
267
-
268
-
269
-
270
-
271
-
272
-
273
-
274
-
275
-
276
-
277
-
278
-
279
-
280
-
281
-
282
-
283
-
284
-
285
-
286
-
287
-
288
-
289
-
290
-
291
-
292
-
293
-
294
-
295
-
296
-
297
-
298
-
299
-
300
-
301
-
302
-
303
-
304
-
305
-
306
-
307
-
308
 |
 |

39
PART II
The ability to integrate Progress Energy businesses and realize cost savings and any other synergies expected from the merger with Progress Energy could be
different from what USFE&G expects and may have a signifi cant impact on USFE&G’s results of operations.
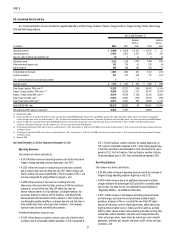
Commercial Power
Years Ended December 31,
(in millions) 2012 2011
Variance
2012 vs.
2011 2010
Variance
2011 vs.
2010
Operating revenues $ 2,078 $ 2,491 $ (413) $ 2,448 $ 43
Operating expenses 1,981 2,300 (319) 2,734 (434)
Gains on sales of other assets and other, net 815 (7) 6 9
Operating income 105 206 (101) (280) 486
Other income and expense, net 39 21 18 44 (23)
Interest expense 63 87 (24) 68 19
Income before income taxes 81 140 (59) (304) 444
Income tax expense (7) (2) (5) 22 (24)
Less: Income attributable to noncontrolling interests 18(7) 1 7
Segment income $87 $ 134 $ (47) $ (327) $ 461
Coal-fi red plant production, GWh 16,164 17,378 (1,214) 19,442 (2,064)
Gas-fi red plant production, GWh 17,122 12,021 5,101 7,026 4,995
Renewable plant production, GWh 3,452 3,132 320 2,286 846
Total Commercial Power production, GWh 36,738 32,531 4,207 28,754 3,777
Net proportional MW capacity in operation 8,094 8,325 (231) 8,272 53
Year Ended December 31, 2012 as Compared to December 31, 2011
Operating Revenues.
The variance was driven primarily by:
• A $285 million decrease in electric revenues from the coal-fi red
generation assets driven primarily by the expiration of the 2009-2011
ESP which dedicated Commercial Power’s coal-fi red generation to
Duke Energy Ohio’s retail customers, net of stability charge revenues,
partially offset by the coal-fi red generation assets participating in the
PJM Interconnection, LLC (PJM) wholesale energy market in 2012,
• A $116 million decrease in electric revenues from Duke Energy Retail
Sales, LLC (Duke Energy Retail) resulting from lower volumes and
unfavorable pricing,
• A $39 million decrease in electric revenues from the gas-fi red
generation assets driven primarily by lower power prices, partially offset
by increased volumes,
• A $27 million decrease in electric revenues from Duke Energy
Generation Services, Inc. (DEGS), excluding renewables, due primarily
to the termination of certain operations at the end of the fi rst quarter of
2011 and a reduction of coal sales volumes as a result of lower natural
gas prices,
• An $18 million decrease in PJM capacity revenues related to lower
average cleared capacity auction pricing in 2012 compared to 2011 for
the gas-fi red generation assets, net of an increase associated with the
move of the coal-fi red generation assets from Midwest Independent
Transmission System Operator, Inc. (MISO) to PJM in 2012, and
• An $8 million decrease in net mark-to-market revenues on non-qualifying
power and capacity hedge contracts, consisting of mark-to-market losses
of $6 million in 2012 compared to gains of $2 million in 2011.
Partially offsetting these decreases were:
• A $64 million increase from participation in competitive retail load
auctions, and
• A $17 million increase in electric revenues from higher production in the
renewables portfolio.
Operating Expenses.
The variance was driven primarily by:
• A $140 million decrease in operating and maintenance expenses
resulting primarily from the prior year recognition of MISO exit fees;
lower transmission costs, prior year station outages, and 2011
regulatory asset amortization expenses,
• An $88 million decrease primarily from the 2011 impairment of excess
emission allowances as a result of the EPA’s issuance of the CSAPR,
• An $85 million decrease in fuel expenses from the gas-fi red generation
assets driven by lower natural gas costs, partially offset by higher
volumes,
• A $19 million decrease in DEGS, excluding renewables, fuel used due
primarily to the termination of certain operations at the end of the fi rst
quarter of 2011 and from lower natural gas prices,
• A $15 million decrease due to the receipt of funds in 2012 related to a
previously written off receivable associated with the Lehman Brothers
bankruptcy,
• A $15 million decrease in purchased power to serve Duke Energy Retail
customers, and
• A $13 million decrease in fuel used for the coal-fi red generation assets
driven primarily by lower generation volumes.