Duke Energy 2012 Annual Report Download - page 192
Download and view the complete annual report
Please find page 192 of the 2012 Duke Energy annual report below. You can navigate through the pages in the report by either clicking on the pages listed below, or by using the keyword search tool below to find specific information within the annual report.-
 1
1 -
2
-
3
-
4
-
5
-
6
-
7
-
8
-
9
-
10
-
11
-
12
-
13
-
14
-
15
-
16
-
17
-
18
-
19
-
20
-
21
-
22
-
23
-
24
-
25
-
26
-
27
-
28
-
29
-
30
-
31
-
32
-
33
-
34
-
35
-
36
-
37
-
38
-
39
-
40
-
41
-
42
-
43
-
44
-
45
-
46
-
47
-
48
-
49
-
50
-
51
-
52
-
53
-
54
-
55
-
56
-
57
-
58
-
59
-
60
-
61
-
62
-
63
-
64
-
65
-
66
-
67
-
68
-
69
-
70
-
71
-
72
-
73
-
74
-
75
-
76
-
77
-
78
-
79
-
80
-
81
-
82
-
83
-
84
-
85
-
86
-
87
-
88
-
89
-
90
-
91
-
92
-
93
-
94
-
95
-
96
-
97
-
98
-
99
-
100
-
101
-
102
-
103
-
104
-
105
-
106
-
107
-
108
-
109
-
110
-
111
-
112
-
113
-
114
-
115
-
116
-
117
-
118
-
119
-
120
-
121
-
122
-
123
-
124
-
125
-
126
-
127
-
128
-
129
-
130
-
131
-
132
-
133
-
134
-
135
-
136
-
137
-
138
-
139
-
140
-
141
-
142
-
143
-
144
-
145
-
146
-
147
-
148
-
149
-
150
-
151
-
152
-
153
-
154
-
155
-
156
-
157
-
158
-
159
-
160
-
161
-
162
-
163
-
164
-
165
-
166
-
167
-
168
-
169
-
170
-
171
-
172
-
173
-
174
-
175
-
176
-
177
-
178
-
179
-
180
-
181
-
 182
182 -
 183
183 -
 184
184 -
 185
185 -
 186
186 -
 187
187 -
 188
188 -
 189
189 -
 190
190 -
 191
191 -
 192
192 -
 193
193 -
 194
194 -
 195
195 -
 196
196 -
 197
197 -
 198
198 -
 199
199 -
 200
200 -
 201
201 -
 202
202 -
203
-
204
-
205
-
206
-
207
-
208
-
209
-
210
-
211
-
212
-
213
-
214
-
215
-
216
-
217
-
218
-
219
-
220
-
221
-
222
-
223
-
224
-
225
-
226
-
227
-
228
-
229
-
230
-
231
-
232
-
233
-
234
-
235
-
236
-
237
-
238
-
239
-
240
-
241
-
242
-
243
-
244
-
245
-
246
-
247
-
248
-
249
-
250
-
251
-
252
-
253
-
254
-
255
-
256
-
257
-
258
-
259
-
260
-
261
-
262
-
263
-
264
-
265
-
266
-
267
-
268
-
269
-
270
-
271
-
272
-
273
-
274
-
275
-
276
-
277
-
278
-
279
-
280
-
281
-
282
-
283
-
284
-
285
-
286
-
287
-
288
-
289
-
290
-
291
-
292
-
293
-
294
-
295
-
296
-
297
-
298
-
299
-
300
-
301
-
302
-
303
-
304
-
305
-
306
-
307
-
308
 |
 |

172
PART II
DUKE ENERGY CORPORATION • DUKE ENERGY CAROLINAS, LLC • PROGRESS ENERGY, INC. • CAROLINA POWER & LIGHT COMPANY d/b/a PROGRESS ENERGY
CAROLINAS, INC. • FLORIDA POWER CORPORATION d/b/a PROGRESS ENERY FLORIDA, INC. • DUKE ENERGY OHIO, INC. • DUKE ENERGY INDIANA, INC.
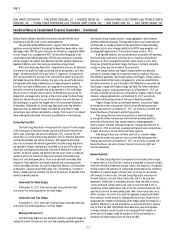
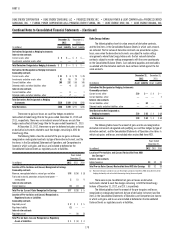
Combined Notes to Consolidated Financial Statements – (Continued)
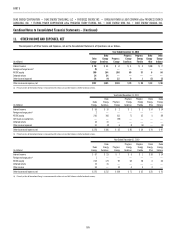
The following table shows the notional amounts for derivatives related to interest rate risk.
Notional Amounts of Derivative Instruments Related to Interest Rate
December 31, 2012
(in millions)
Duke
Energy
Duke Energy
Carolinas
Progress
Energy
Progress Energy
Carolinas
Progress Energy
Florida
Duke Energy
Ohio
Duke Energy
Indiana
Cash fl ow hedges(a) $1,047 $— $— $— $— $ — $ —
Undesignated contracts 290 — 50 50 — 27 200
Fair value hedges 250 — — — — 250 —
Total notional amount $1,587 $— $ 50 $ 50 $— $277 $200
December 31, 2011
(in millions)
Duke
Energy
Duke Energy
Carolinas
Progress
Energy
Progress Energy
Carolinas
Progress Energy
Florida
Duke Energy
Ohio
Duke Energy
Indiana
Cash fl ow hedges(a) $ 841 $ — $500 $250 $ 50 $ — $ —
Undesignated contracts 247 — — — — 27 200
Fair value hedges 275 25 — — — 250 —
Total notional amount $1,363 $ 25 $500 $250 $ 50 $277 $200
(a) Duke Energy includes amounts related to non-recourse variable rate long-term debt of VIEs of $620 million at December 31, 2012 and $466 million at December 31, 2011.
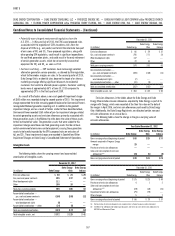
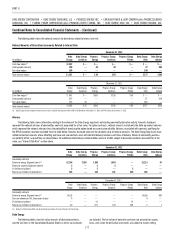
Volumes
The following table shows information relating to the volume of the Duke Energy registrants outstanding commodity derivative activity. Amounts disclosed
represent the notional volumes of commodities contracts accounted for at fair value. For option contracts, notional amounts include only the delta-equivalent volumes
which represent the notional volumes times the probability of exercising the option based on current price volatility. Volumes associated with contracts qualifying for
the NPNS exception have been excluded from the table below. Amounts disclosed represent the absolute value of notional amounts. The Duke Energy Registrants have
netted contractual amounts where offsetting purchase and sale contracts exist with identical delivery locations and times of delivery. Where all commodity positions
are perfectly offset, no quantities are shown below. For additional information on notional dollar amounts of debt subject to derivative contracts accounted for at fair
value, see “Interest Rate Risk” section above.
December 31, 2012
Duke
Energy
Duke Energy
Carolinas
Progress
Energy
Progress Energy
Carolinas
Progress Energy
Florida
Duke Energy
Ohio
Duke Energy
Indiana
Commodity contracts
Electricity-energy (Gigawatt-hours)(a) 52,104 2,028 1,850 1,850 — 51,215 97
Electricity-capacity (Gigawatt-months) 5 — 5 5 — — —
Oil (millions of gallons) 5 — 5 — 5 — —
Natural gas (millions of decatherms) 528 — 348 118 230 180 —
December 31, 2011
Duke
Energy
Duke Energy
Carolinas
Progress
Energy
Progress Energy
Carolinas
Progress Energy
Florida
Duke Energy
Ohio
Duke Energy
Indiana
Commodity contracts
Electricity-energy (Gigawatt-hours)(a) 14,118 — — — — 14,655 682
Emission allowances NOx (thousands of tons) 9 — — — — 9 —
Oil (millions of gallons) — — 10 — 10 — —
Natural gas (millions of decatherms) 40 — 347 103 244 2 1
(a) Amounts at Duke Energy Ohio include intercompany positions that are eliminated at Duke Energy.
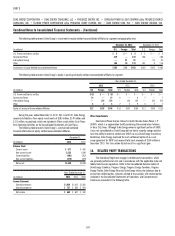
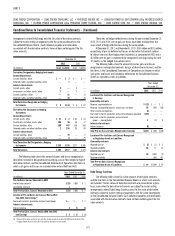
Duke Energy
The following tables show fair value amounts of derivative contracts,
and the line items in the Consolidated Balance Sheets in which such amounts
are included. The fair values of derivative contracts are presented on a gross
basis, even when the derivative instruments are subject to master netting