Duke Energy 2012 Annual Report Download - page 229
Download and view the complete annual report
Please find page 229 of the 2012 Duke Energy annual report below. You can navigate through the pages in the report by either clicking on the pages listed below, or by using the keyword search tool below to find specific information within the annual report.-
 1
1 -
2
-
3
-
4
-
5
-
6
-
7
-
8
-
9
-
10
-
11
-
12
-
13
-
14
-
15
-
16
-
17
-
18
-
19
-
20
-
21
-
22
-
23
-
24
-
25
-
26
-
27
-
28
-
29
-
30
-
31
-
32
-
33
-
34
-
35
-
36
-
37
-
38
-
39
-
40
-
41
-
42
-
43
-
44
-
45
-
46
-
47
-
48
-
49
-
50
-
51
-
52
-
53
-
54
-
55
-
56
-
57
-
58
-
59
-
60
-
61
-
62
-
63
-
64
-
65
-
66
-
67
-
68
-
69
-
70
-
71
-
72
-
73
-
74
-
75
-
76
-
77
-
78
-
79
-
80
-
81
-
82
-
83
-
84
-
85
-
86
-
87
-
88
-
89
-
90
-
91
-
92
-
93
-
94
-
95
-
96
-
97
-
98
-
99
-
100
-
101
-
102
-
103
-
104
-
105
-
106
-
107
-
108
-
109
-
110
-
111
-
112
-
113
-
114
-
115
-
116
-
117
-
118
-
119
-
120
-
121
-
122
-
123
-
124
-
125
-
126
-
127
-
128
-
129
-
130
-
131
-
132
-
133
-
134
-
135
-
136
-
137
-
138
-
139
-
140
-
141
-
142
-
143
-
144
-
145
-
146
-
147
-
148
-
149
-
150
-
151
-
152
-
153
-
154
-
155
-
156
-
157
-
158
-
159
-
160
-
161
-
162
-
163
-
164
-
165
-
166
-
167
-
168
-
169
-
170
-
171
-
172
-
173
-
174
-
175
-
176
-
177
-
178
-
179
-
180
-
181
-
182
-
183
-
184
-
185
-
186
-
187
-
188
-
189
-
190
-
191
-
192
-
193
-
194
-
195
-
196
-
197
-
198
-
199
-
200
-
201
-
202
-
203
-
204
-
205
-
206
-
207
-
208
-
209
-
210
-
211
-
212
-
213
-
214
-
215
-
216
-
217
-
218
-
 219
219 -
 220
220 -
 221
221 -
 222
222 -
 223
223 -
 224
224 -
 225
225 -
 226
226 -
 227
227 -
 228
228 -
 229
229 -
 230
230 -
 231
231 -
 232
232 -
 233
233 -
 234
234 -
 235
235 -
 236
236 -
 237
237 -
 238
238 -
 239
239 -
240
-
241
-
242
-
243
-
244
-
245
-
246
-
247
-
248
-
249
-
250
-
251
-
252
-
253
-
254
-
255
-
256
-
257
-
258
-
259
-
260
-
261
-
262
-
263
-
264
-
265
-
266
-
267
-
268
-
269
-
270
-
271
-
272
-
273
-
274
-
275
-
276
-
277
-
278
-
279
-
280
-
281
-
282
-
283
-
284
-
285
-
286
-
287
-
288
-
289
-
290
-
291
-
292
-
293
-
294
-
295
-
296
-
297
-
298
-
299
-
300
-
301
-
302
-
303
-
304
-
305
-
306
-
307
-
308
 |
 |

209
PART II
DUKE ENERGY CORPORATION • DUKE ENERGY CAROLINAS, LLC • PROGRESS ENERGY, INC. • CAROLINA POWER & LIGHT COMPANY d/b/a PROGRESS
ENERGY CAROLINAS, INC. • FLORIDA POWER CORPORATION d/b/a PROGRESS ENERY FLORIDA, INC. • DUKE ENERGY OHIO, INC. • DUKE ENERGY INDIANA, INC.
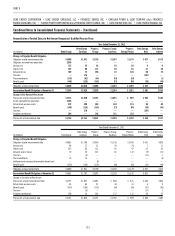
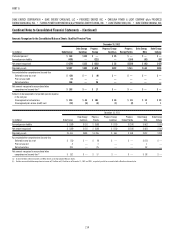
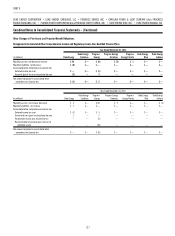
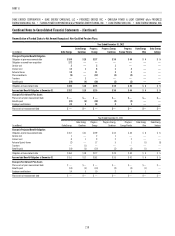
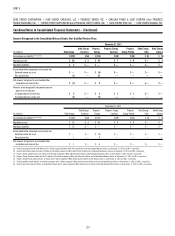
Combined Notes to Consolidated Financial Statements – (Continued)
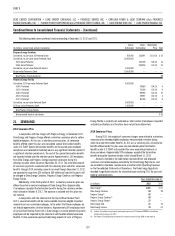
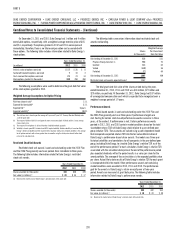
On December 31, 2011 and 2010, Duke Energy had 1 million and 4 million
exercisable options, respectively, with a weighted-average exercise price of $45
and $51, respectively. The options granted in 2012 and 2011 were expensed
immediately; therefore, there is no future compensation cost associated with
these options. The following table includes information related to Duke Energy’s
stock options.
Years Ended December 31,
(in millions) 2012 2011 2010
Intrinsic value of options exercised $ 17 $ 26 $ 8
Tax benefi t related to options exercised 7 10 3
Cash received from options exercised 21 74 14
Stock options granted (in thousands) 340 358 368
The following assumptions were used to determine the grant date fair value
of the stock options granted in 2012.
Weighted-Average Assumptions for Option Pricing
Risk-free interest rate(a) 1.1 %
Expected dividend yield(b) 5.1 %
Expected life(c) 6 years
Expected volatility(d) 18.8 %
(a) The risk-free rate is based upon the average of 5-year and 7-year U.S. Treasury Constant Maturity rates
as of the grant date.
(b) The expected dividend yield is based upon the most recent annualized dividend and the 1-year average
closing stock price.
(c) The expected life of options is derived from the simplifi ed method approach.
(d) Volatility is based upon 50% historical and 50% implied volatility. Historic volatility is based on Duke
Energy’s historical volatility over the expected life using daily stock prices. Implied volatility is the average
for all option contracts with a term greater than six months using the strike price closest to the stock
price on the valuation date.
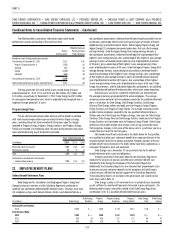
Restricted Stock Unit Awards
Restricted stock unit awards issued and outstanding under the 2010 Plan
and the 2006 Plan generally vest over periods from immediate to three years.
The following table includes information related to Duke Energy’s restricted
stock unit awards.
Years Ended December 31,
2012 2011 2010
Shares awarded (in thousands) 443 636 349
Fair value (in millions)(a) $28 $34 $ 17
(a) Based on the market price of Duke Energy’s common stock at the grant date.
The following table summarizes information about restricted stock unit
awards outstanding.
Shares
(in thousands)
Weighted-Average
Per Share Grant
Date Fair Value
Outstanding at December 31, 2011 856 $51
Progress Energy transfers in 988 70
Granted 443 63
Vested (608) 56
Forfeited (72) 64
Outstanding at December 31, 2012 1,607 64
Restricted stock unit awards expected to vest 1,567 64
The total grant date fair value of the shares vested during the years
ended December 31, 2012, 2011 and 2010 was $34 million, $19 million and
$29 million, respectively. At December 31, 2012, Duke Energy had $37 million
of unrecognized compensation cost which is expected to be recognized over a
weighted-average period of 1.9 years.
Performance Awards
Stock-based awards issued and outstanding under the 2010 Plan and
the 2006 Plan generally vest over three years if performance targets are
met. Vesting for certain stock-based performance awards can occur in three
years, at the earliest, if performance is met. Certain performance awards
granted in 2012, 2011 and 2010 contain market conditions based on the total
shareholder return (TSR) of Duke Energy stock relative to a pre-defi ned peer
group (relative TSR). These awards are valued using a path-dependent model
that incorporates expected relative TSR into the fair value determination of
Duke Energy’s performance-based share awards. The model uses three-year
historical volatilities and correlations for all companies in the pre-defi ned peer
group, including Duke Energy, to simulate Duke Energy’s relative TSR as of the
end of the performance period. For each simulation, Duke Energy’s relative TSR
associated with the simulated stock price at the end of the performance period
plus expected dividends within the period results in a value per share for the
award portfolio. The average of these simulations is the expected portfolio value
per share. Actual life to date results of Duke Energy’s relative TSR for each grant
is incorporated within the model. Other performance awards not containing
market conditions were awarded in 2012, 2011 and 2010. The performance
goal for the awards is Duke Energy’s return on equity over a three-year
period. Awards are measured at grant date price. The following table includes
information related to Duke Energy’s performance awards.
Years Ended December 31,
2012 2011 2010
Shares awarded (in thousands) 352 432 912
Fair value (in millions)(a) $19 $20 $ 38
(a) Based on the market price of Duke Energy’s common stock at the grant date.