Duke Energy 2012 Annual Report Download - page 203
Download and view the complete annual report
Please find page 203 of the 2012 Duke Energy annual report below. You can navigate through the pages in the report by either clicking on the pages listed below, or by using the keyword search tool below to find specific information within the annual report.-
 1
1 -
2
-
3
-
4
-
5
-
6
-
7
-
8
-
9
-
10
-
11
-
12
-
13
-
14
-
15
-
16
-
17
-
18
-
19
-
20
-
21
-
22
-
23
-
24
-
25
-
26
-
27
-
28
-
29
-
30
-
31
-
32
-
33
-
34
-
35
-
36
-
37
-
38
-
39
-
40
-
41
-
42
-
43
-
44
-
45
-
46
-
47
-
48
-
49
-
50
-
51
-
52
-
53
-
54
-
55
-
56
-
57
-
58
-
59
-
60
-
61
-
62
-
63
-
64
-
65
-
66
-
67
-
68
-
69
-
70
-
71
-
72
-
73
-
74
-
75
-
76
-
77
-
78
-
79
-
80
-
81
-
82
-
83
-
84
-
85
-
86
-
87
-
88
-
89
-
90
-
91
-
92
-
93
-
94
-
95
-
96
-
97
-
98
-
99
-
100
-
101
-
102
-
103
-
104
-
105
-
106
-
107
-
108
-
109
-
110
-
111
-
112
-
113
-
114
-
115
-
116
-
117
-
118
-
119
-
120
-
121
-
122
-
123
-
124
-
125
-
126
-
127
-
128
-
129
-
130
-
131
-
132
-
133
-
134
-
135
-
136
-
137
-
138
-
139
-
140
-
141
-
142
-
143
-
144
-
145
-
146
-
147
-
148
-
149
-
150
-
151
-
152
-
153
-
154
-
155
-
156
-
157
-
158
-
159
-
160
-
161
-
162
-
163
-
164
-
165
-
166
-
167
-
168
-
169
-
170
-
171
-
172
-
173
-
174
-
175
-
176
-
177
-
178
-
179
-
180
-
181
-
182
-
183
-
184
-
185
-
186
-
187
-
188
-
189
-
190
-
191
-
192
-
 193
193 -
 194
194 -
 195
195 -
 196
196 -
 197
197 -
 198
198 -
 199
199 -
 200
200 -
 201
201 -
 202
202 -
 203
203 -
 204
204 -
 205
205 -
 206
206 -
 207
207 -
 208
208 -
 209
209 -
 210
210 -
 211
211 -
 212
212 -
 213
213 -
214
-
215
-
216
-
217
-
218
-
219
-
220
-
221
-
222
-
223
-
224
-
225
-
226
-
227
-
228
-
229
-
230
-
231
-
232
-
233
-
234
-
235
-
236
-
237
-
238
-
239
-
240
-
241
-
242
-
243
-
244
-
245
-
246
-
247
-
248
-
249
-
250
-
251
-
252
-
253
-
254
-
255
-
256
-
257
-
258
-
259
-
260
-
261
-
262
-
263
-
264
-
265
-
266
-
267
-
268
-
269
-
270
-
271
-
272
-
273
-
274
-
275
-
276
-
277
-
278
-
279
-
280
-
281
-
282
-
283
-
284
-
285
-
286
-
287
-
288
-
289
-
290
-
291
-
292
-
293
-
294
-
295
-
296
-
297
-
298
-
299
-
300
-
301
-
302
-
303
-
304
-
305
-
306
-
307
-
308
 |
 |

183
PART II
DUKE ENERGY CORPORATION • DUKE ENERGY CAROLINAS, LLC • PROGRESS ENERGY, INC. • CAROLINA POWER & LIGHT COMPANY d/b/a PROGRESS ENERGY
CAROLINAS, INC. • FLORIDA POWER CORPORATION d/b/a PROGRESS ENERY FLORIDA, INC. • DUKE ENERGY OHIO, INC. • DUKE ENERGY INDIANA, INC
.
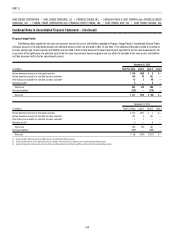
Combined Notes to Consolidated Financial Statements – (Continued)
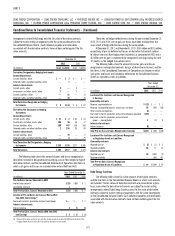
The following tables provide a reconciliation of beginning and ending balances of assets and liabilities measured at fair value on a recurring basis where the
determination of fair value includes signifi cant unobservable inputs (Level 3).
Year Ended December 31, 2012
(in millions)
Available-for-Sale
Auction Rate
Securities
Available-for-Sale
NDTF
Investments
Derivatives
(net) Total
Balance at December 31, 2011 $ 71 $ 53 $ (39) $ 85
Amounts acquired in Progress Energy Merger — — (30) (30)
Total pre-tax realized or unrealized gains (losses) included in earnings:
Regulated electric — — 23 23
Revenue, nonregulated electric, natural gas, and other — — (15) (15)
Total pre-tax gains included in other comprehensive income:
Gains on available for sale securities and other 13 — — 13
Purchases, sales, issuances and settlements:
Purchases — 14 22 36
Sales — (2) — (2)
Issuances — — (15) (15)
Settlements (55) — (32) (87)
Total gains included on the Consolidated Balance Sheet as regulatory asset or liability — 4 1 5
Balance at December 31, 2012 $ 29 $ 69 $ (85) $ 13
Pre-tax amounts included in the Consolidated Statements of Comprehensive Income related to Level 3
measurements outstanding at December 31, 2012
Regulated electric $ — $ — $ (24) (24)
Revenue, nonregulated electric, natural gas, and other — — 1 1
Total $ — $ — $ (23) $(23)
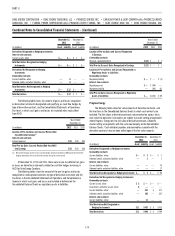
Year Ended December 31, 2011
(in millions)
Available-for-Sale
Auction Rate
Securities
Available-for-Sale
NDTF
Investments
Derivatives
(net) Total
Balance at December 31, 2010 $118 $ 47 $(19) $146
Total pre-tax realized or unrealized gains (losses) included in earnings:
Regulated electric — — 13 13
Revenue, nonregulated electric, natural gas, and other — — (27) (27)
Total pre-tax gains included in other comprehensive income:
Gains on available for sale securities and other 12 — — 12
Purchases, sales, issuances and settlements:
Purchases — 8 8 16
Sales — (3) — (3)
Settlements (16) — (16) (32)
Total gains included on the Consolidated Balance Sheet as regulatory asset or liability — 1 2 3
Transfers out of Level 3 (43) — — (43)
Balance at December 31, 2011 $ 71 $ 53 $(39) $ 85
Pre-tax amounts included in the Consolidated Statements of Comprehensive Income related to Level 3
measurements outstanding at December 31, 2011
Revenue, nonregulated electric, natural gas, and other — — (20) (20)
Total $ — $— $(20) $ (20)