Duke Energy 2012 Annual Report Download - page 248
Download and view the complete annual report
Please find page 248 of the 2012 Duke Energy annual report below. You can navigate through the pages in the report by either clicking on the pages listed below, or by using the keyword search tool below to find specific information within the annual report.-
 1
1 -
2
-
3
-
4
-
5
-
6
-
7
-
8
-
9
-
10
-
11
-
12
-
13
-
14
-
15
-
16
-
17
-
18
-
19
-
20
-
21
-
22
-
23
-
24
-
25
-
26
-
27
-
28
-
29
-
30
-
31
-
32
-
33
-
34
-
35
-
36
-
37
-
38
-
39
-
40
-
41
-
42
-
43
-
44
-
45
-
46
-
47
-
48
-
49
-
50
-
51
-
52
-
53
-
54
-
55
-
56
-
57
-
58
-
59
-
60
-
61
-
62
-
63
-
64
-
65
-
66
-
67
-
68
-
69
-
70
-
71
-
72
-
73
-
74
-
75
-
76
-
77
-
78
-
79
-
80
-
81
-
82
-
83
-
84
-
85
-
86
-
87
-
88
-
89
-
90
-
91
-
92
-
93
-
94
-
95
-
96
-
97
-
98
-
99
-
100
-
101
-
102
-
103
-
104
-
105
-
106
-
107
-
108
-
109
-
110
-
111
-
112
-
113
-
114
-
115
-
116
-
117
-
118
-
119
-
120
-
121
-
122
-
123
-
124
-
125
-
126
-
127
-
128
-
129
-
130
-
131
-
132
-
133
-
134
-
135
-
136
-
137
-
138
-
139
-
140
-
141
-
142
-
143
-
144
-
145
-
146
-
147
-
148
-
149
-
150
-
151
-
152
-
153
-
154
-
155
-
156
-
157
-
158
-
159
-
160
-
161
-
162
-
163
-
164
-
165
-
166
-
167
-
168
-
169
-
170
-
171
-
172
-
173
-
174
-
175
-
176
-
177
-
178
-
179
-
180
-
181
-
182
-
183
-
184
-
185
-
186
-
187
-
188
-
189
-
190
-
191
-
192
-
193
-
194
-
195
-
196
-
197
-
198
-
199
-
200
-
201
-
202
-
203
-
204
-
205
-
206
-
207
-
208
-
209
-
210
-
211
-
212
-
213
-
214
-
215
-
216
-
217
-
218
-
219
-
220
-
221
-
222
-
223
-
224
-
225
-
226
-
227
-
228
-
229
-
230
-
231
-
232
-
233
-
234
-
235
-
236
-
237
-
 238
238 -
 239
239 -
 240
240 -
 241
241 -
 242
242 -
 243
243 -
 244
244 -
 245
245 -
 246
246 -
 247
247 -
 248
248 -
 249
249 -
 250
250 -
 251
251 -
 252
252 -
 253
253 -
 254
254 -
 255
255 -
 256
256 -
 257
257 -
 258
258 -
259
-
260
-
261
-
262
-
263
-
264
-
265
-
266
-
267
-
268
-
269
-
270
-
271
-
272
-
273
-
274
-
275
-
276
-
277
-
278
-
279
-
280
-
281
-
282
-
283
-
284
-
285
-
286
-
287
-
288
-
289
-
290
-
291
-
292
-
293
-
294
-
295
-
296
-
297
-
298
-
299
-
300
-
301
-
302
-
303
-
304
-
305
-
306
-
307
-
308
 |
 |

228
PART II
DUKE ENERGY CORPORATION • DUKE ENERGY CAROLINAS, LLC • PROGRESS ENERGY, INC. • CAROLINA POWER & LIGHT COMPANY d/b/a PROGRESS
ENERGY CAROLINAS, INC. • FLORIDA POWER CORPORATION d/b/a PROGRESS ENERY FLORIDA, INC. • DUKE ENERGY OHIO, INC. • DUKE ENERGY INDIANA, INC.
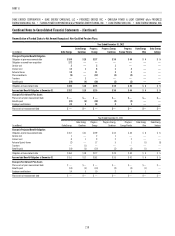
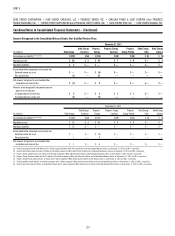
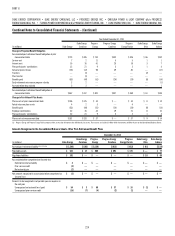
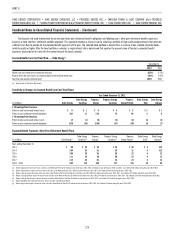
Combined Notes to Consolidated Financial Statements – (Continued)
Target
Allocation
Actual Allocation at December 31,
(percentages) 2012 2011
Progress Energy Master Trust
U.S. equity securities 29 20 28
Non-U.S. equity securities 19 14 15
Global equity securities 4 8 9
Global private equity securities 6 10 —
Debt securities 35 35 36
Hedge funds 7 9 6
Real estate and cash — 1 6
Other global securities — 3 —
Total 100 100 100
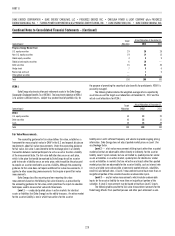
VEBA I.
Duke Energy also invests other post-retirement assets in the Duke Energy
Corporation Employee Benefi ts Trust (VEBA I). The investment objective of VEBA I
is to achieve suffi cient returns, subject to a prudent level of portfolio risk, for
the purpose of promoting the security of plan benefi ts for participants. VEBA I is
passively managed.
The following table includes the weighted-average returns expected by
asset classes and the target asset allocations at December 31, 2012 and the
actual asset allocations for VEBA I.
Target
Allocation
Actual Allocation at December 31,
(percentages) 2012 2011
VEBA I
U.S. equity securities 30 23 20
Debt securities 45 32 31
Cash 25 45 49
Total 100 100 100
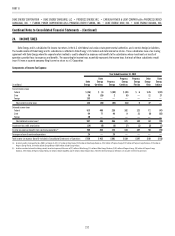
Fair Value Measurements.
The accounting guidance for fair value defi nes fair value, establishes a
framework for measuring fair value in GAAP in the U.S. and expands disclosure
requirements about fair value measurements. Under the accounting guidance
for fair value, fair value is considered to be the exchange price in an orderly
transaction between market participants to sell an asset or transfer a liability
at the measurement date. The fair value defi nition focuses on an exit price,
which is the price that would be received by Duke Energy to sell an asset or
paid to transfer a liability versus an entry price, which would be the price paid
to acquire an asset or received to assume a liability. Although the accounting
guidance for fair value does not require additional fair value measurements, it
applies to other accounting pronouncements that require or permit fair value
measurements.
Duke Energy classifi es recurring and non-recurring fair value
measurements based on the following fair value hierarchy, as prescribed by
the accounting guidance for fair value, which prioritizes the inputs to valuation
techniques used to measure fair value into three levels:
Level 1 — unadjusted quoted prices in active markets for identical
assets or liabilities that Duke Energy has the ability to access. An active market
for the asset or liability is one in which transactions for the asset or
liability occurs with suffi cient frequency and volume to provide ongoing pricing
information. Duke Energy does not adjust quoted market prices on Level 1 for
any blockage factor.
Level 2 — a fair value measurement utilizing inputs other than a quoted
market price that are observable, either directly or indirectly, for the asset or
liability. Level 2 inputs include, but are not limited to, quoted prices for similar
assets or liabilities in an active market, quoted prices for identical or similar
assets or liabilities in markets that are not active and inputs other than quoted
market prices that are observable for the asset or liability, such as interest rate
curves and yield curves observable at commonly quoted intervals, volatilities,
credit risk and default rates. A Level 2 measurement cannot have more than an
insignifi cant portion of the valuation based on unobservable inputs.
Level 3 — any fair value measurements which include unobservable
inputs for the asset or liability for more than an insignifi cant portion of the
valuation. A Level 3 measurement may be based primarily on Level 2 inputs.
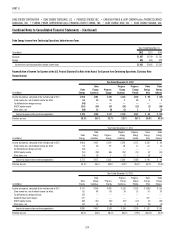
The following tables provide the fair value measurement amounts for the
Duke Energy Master Trust qualifi ed pension and other post-retirement assets.