Duke Energy 2012 Annual Report Download - page 61
Download and view the complete annual report
Please find page 61 of the 2012 Duke Energy annual report below. You can navigate through the pages in the report by either clicking on the pages listed below, or by using the keyword search tool below to find specific information within the annual report.-
 1
1 -
2
-
3
-
4
-
5
-
6
-
7
-
8
-
9
-
10
-
11
-
12
-
13
-
14
-
15
-
16
-
17
-
18
-
19
-
20
-
21
-
22
-
23
-
24
-
25
-
26
-
27
-
28
-
29
-
30
-
31
-
32
-
33
-
34
-
35
-
36
-
37
-
38
-
39
-
40
-
41
-
42
-
43
-
44
-
45
-
46
-
47
-
48
-
49
-
50
-
 51
51 -
 52
52 -
 53
53 -
 54
54 -
 55
55 -
 56
56 -
 57
57 -
 58
58 -
 59
59 -
 60
60 -
 61
61 -
 62
62 -
 63
63 -
 64
64 -
 65
65 -
 66
66 -
 67
67 -
 68
68 -
 69
69 -
 70
70 -
 71
71 -
72
-
73
-
74
-
75
-
76
-
77
-
78
-
79
-
80
-
81
-
82
-
83
-
84
-
85
-
86
-
87
-
88
-
89
-
90
-
91
-
92
-
93
-
94
-
95
-
96
-
97
-
98
-
99
-
100
-
101
-
102
-
103
-
104
-
105
-
106
-
107
-
108
-
109
-
110
-
111
-
112
-
113
-
114
-
115
-
116
-
117
-
118
-
119
-
120
-
121
-
122
-
123
-
124
-
125
-
126
-
127
-
128
-
129
-
130
-
131
-
132
-
133
-
134
-
135
-
136
-
137
-
138
-
139
-
140
-
141
-
142
-
143
-
144
-
145
-
146
-
147
-
148
-
149
-
150
-
151
-
152
-
153
-
154
-
155
-
156
-
157
-
158
-
159
-
160
-
161
-
162
-
163
-
164
-
165
-
166
-
167
-
168
-
169
-
170
-
171
-
172
-
173
-
174
-
175
-
176
-
177
-
178
-
179
-
180
-
181
-
182
-
183
-
184
-
185
-
186
-
187
-
188
-
189
-
190
-
191
-
192
-
193
-
194
-
195
-
196
-
197
-
198
-
199
-
200
-
201
-
202
-
203
-
204
-
205
-
206
-
207
-
208
-
209
-
210
-
211
-
212
-
213
-
214
-
215
-
216
-
217
-
218
-
219
-
220
-
221
-
222
-
223
-
224
-
225
-
226
-
227
-
228
-
229
-
230
-
231
-
232
-
233
-
234
-
235
-
236
-
237
-
238
-
239
-
240
-
241
-
242
-
243
-
244
-
245
-
246
-
247
-
248
-
249
-
250
-
251
-
252
-
253
-
254
-
255
-
256
-
257
-
258
-
259
-
260
-
261
-
262
-
263
-
264
-
265
-
266
-
267
-
268
-
269
-
270
-
271
-
272
-
273
-
274
-
275
-
276
-
277
-
278
-
279
-
280
-
281
-
282
-
283
-
284
-
285
-
286
-
287
-
288
-
289
-
290
-
291
-
292
-
293
-
294
-
295
-
296
-
297
-
298
-
299
-
300
-
301
-
302
-
303
-
304
-
305
-
306
-
307
-
308
 |
 |

41
PART II
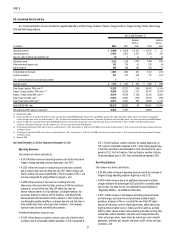
International Energy
Years Ended December 31,
(in millions) 2012 2011
Variance
2012 vs.
2011 2010
Variance
2011 vs.
2010
Operating revenues $ 1,549 $ 1,467 $ 82 $ 1,204 $ 263
Operating expenses 1,043 946 97 816 130
Losses on sales of other assets and other, net —(1) 1 (3) 2
Operating income 506 520 (14) 385 135
Other income and expense, net 171 203 (32) 146 57
Interest expense 76 47 29 71 (24)
Income before income taxes 601 676 (75) 460 216
Income tax expense 149 195 (46) 143 52
Less: Income attributable to noncontrolling interests 13 15 (2) 12 3
Segment income $ 439 $ 466 $ (27) $ 305 $ 161
Sales, GWh 20,132 18,889 1,243 19,504 (615)
Net proportional MW capacity in operation 4,584 4,277 307 4,203 74
Year Ended December 31, 2012 as Compared to December 31, 2011
Operating Revenues.
The variance was driven primarily by:
• A $53 million increase in Central America as a result of higher volumes
due to a full year of commercial operations of the Las Palmas II plant
and favorable hydrology,
• A $24 million increase in Peru due to higher average prices, and
• A $10 million increase in Argentina due to higher volumes as a result of
favorable hydrology, partially offset by unfavorable exchange rates.
Partially offsetting this increase was:
• A $7 million decrease in Brazil as a result of unfavorable exchange
rates partially offset by higher average prices and volumes.
Operating Expenses.
The variance was driven primarily by:
• A $76 million increase in Central America due to higher fuel costs and
consumption as a result of increased dispatch,
• An $8 million increase in general and administrative due to higher
development costs, labor, and executive benefi ts, and
• A $7 million increase in Argentina as a result of higher transmission,
water royalty and purchased power costs.
Other Income and Expense, net.
The variance was primarily driven by the absence of a $20 million
arbitration award in Peru.
Interest Expense.
The variance was primarily due to lower capitalized interest in Central
America and Brazil, as well as higher infl ation partially offset by favorable
exchange rates in Brazil.
Income Tax Expense.
The variance in tax expense is primarily due to a decrease in pretax
income. The effective tax rate for the year ended December 31, 2012 and 2011
was 24.8% and 28.9%, respectively.
Segment Income.
The variance was primarily due to unfavorable exchange rates in Brazil,
the prior year Peru arbitration award, and lower margins in Central America,
partially offset by higher average prices and volumes in Brazil and higher
average prices in Peru.
Year Ended December 31, 2011 as Compared to December 31, 2010
Operating Revenues.
The variance was driven primarily by:
• A $111 million increase in Central America as a result of higher average
prices and favorable hydrology,
• A $95 million increase in Brazil due to favorable exchange rates, and
higher average contract prices and volumes, and
• An $80 million increase in Peru due to higher average prices and
volumes, and hydrocarbon prices.
Partially offsetting this increase was:
• A $25 million decrease in Ecuador as a result of lower dispatch due to
new hydro competitor commencing operations and energy imports from
Colombia.
Operating Expenses.
The variance was driven primarily by:
• A $77 million increase in Central America due to higher fuel costs and
consumption as a result of increased dispatch,
• A $56 million increase in Peru as a result of higher fuel costs and
consumption as a result of increased dispatch, and higher purchased
power and hydrocarbon royalty costs, and
• A $25 million increase in Brazil as a result of unfavorable exchange
rates, higher purchased power and a provision for a revenue tax audit.