Duke Energy 2012 Annual Report Download - page 68
Download and view the complete annual report
Please find page 68 of the 2012 Duke Energy annual report below. You can navigate through the pages in the report by either clicking on the pages listed below, or by using the keyword search tool below to find specific information within the annual report.-
 1
1 -
2
-
3
-
4
-
5
-
6
-
7
-
8
-
9
-
10
-
11
-
12
-
13
-
14
-
15
-
16
-
17
-
18
-
19
-
20
-
21
-
22
-
23
-
24
-
25
-
26
-
27
-
28
-
29
-
30
-
31
-
32
-
33
-
34
-
35
-
36
-
37
-
38
-
39
-
40
-
41
-
42
-
43
-
44
-
45
-
46
-
47
-
48
-
49
-
50
-
51
-
52
-
53
-
54
-
55
-
56
-
57
-
 58
58 -
 59
59 -
 60
60 -
 61
61 -
 62
62 -
 63
63 -
 64
64 -
 65
65 -
 66
66 -
 67
67 -
 68
68 -
 69
69 -
 70
70 -
 71
71 -
 72
72 -
 73
73 -
 74
74 -
 75
75 -
 76
76 -
 77
77 -
 78
78 -
79
-
80
-
81
-
82
-
83
-
84
-
85
-
86
-
87
-
88
-
89
-
90
-
91
-
92
-
93
-
94
-
95
-
96
-
97
-
98
-
99
-
100
-
101
-
102
-
103
-
104
-
105
-
106
-
107
-
108
-
109
-
110
-
111
-
112
-
113
-
114
-
115
-
116
-
117
-
118
-
119
-
120
-
121
-
122
-
123
-
124
-
125
-
126
-
127
-
128
-
129
-
130
-
131
-
132
-
133
-
134
-
135
-
136
-
137
-
138
-
139
-
140
-
141
-
142
-
143
-
144
-
145
-
146
-
147
-
148
-
149
-
150
-
151
-
152
-
153
-
154
-
155
-
156
-
157
-
158
-
159
-
160
-
161
-
162
-
163
-
164
-
165
-
166
-
167
-
168
-
169
-
170
-
171
-
172
-
173
-
174
-
175
-
176
-
177
-
178
-
179
-
180
-
181
-
182
-
183
-
184
-
185
-
186
-
187
-
188
-
189
-
190
-
191
-
192
-
193
-
194
-
195
-
196
-
197
-
198
-
199
-
200
-
201
-
202
-
203
-
204
-
205
-
206
-
207
-
208
-
209
-
210
-
211
-
212
-
213
-
214
-
215
-
216
-
217
-
218
-
219
-
220
-
221
-
222
-
223
-
224
-
225
-
226
-
227
-
228
-
229
-
230
-
231
-
232
-
233
-
234
-
235
-
236
-
237
-
238
-
239
-
240
-
241
-
242
-
243
-
244
-
245
-
246
-
247
-
248
-
249
-
250
-
251
-
252
-
253
-
254
-
255
-
256
-
257
-
258
-
259
-
260
-
261
-
262
-
263
-
264
-
265
-
266
-
267
-
268
-
269
-
270
-
271
-
272
-
273
-
274
-
275
-
276
-
277
-
278
-
279
-
280
-
281
-
282
-
283
-
284
-
285
-
286
-
287
-
288
-
289
-
290
-
291
-
292
-
293
-
294
-
295
-
296
-
297
-
298
-
299
-
300
-
301
-
302
-
303
-
304
-
305
-
306
-
307
-
308
 |
 |

48
PART II
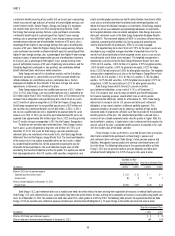
The following table shows the percent changes in GWh sales and average number of customers for Progress Energy Florida. Except as otherwise noted, the
below percentages represent billed sales only for the periods presented and are not weather normalized.
Increase (decrease) over prior year 2012 2011
Residential sales(a) (5.1)% (6.3)%
General service sales(a) (1.0)% (0.4)%
Industrial sales(a) (2.5)% 0.7%
Wholesale power sales (34.2)% (25.1)%
Total sales(b) (2.9)% (8.5)%
Average number of customers 0.8% 0.5%
(a) Major components of retail sales.
(b) Consists of all components of sales, including all billed and unbilled retail sales, and wholesale sales to incorporated municipalities and to public and private utilities and power marketers.
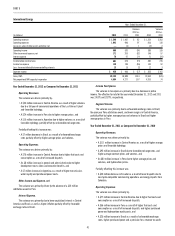
The decrease in Progress Energy Florida’s net income for the year ended
December 31, 2012 compared to December 31, 2011 was primarily due to the
following factors:
Operating Revenues.
The variance was primarily due to:
• A $266 million increase in fuel and capacity revenues driven primarily
by the 2011 charge of $288 million for the amount to be refunded
through the fuel clause in accordance with the 2012 FPSC settlement
agreement and the impact of higher residential fuel rates, partially offset
by unfavorable weather conditions that impacted wholesale and retail
fuel revenues. Also, Progress Energy Florida had lower capacity revenues
resulting from a lower capacity rate and the lower sales volume,
• A $28 million increase in other operating revenues primarily due to
higher OATT rates, and
• A $15 million increase in sales to wholesale customers primarily due to
a new contract with a major customer.
Partially offsetting these increases was:
• A $19 million decrease in sales to retail customers due to unfavorable
weather conditions. The number of heating degree days for the 12
months ended December 31, 2012 was 22% below normal compared
to 12% below normal in the same period in 2011. In addition, cooling
degree days for the 12 months ended December 31, 2012 were 4% above
normal compared to 5% above normal in the same period in 2011.
Operating Expenses.
The variance was primarily due to:
• A $146 million increase in Impairment charges due to the impact of the
decision to retire Crystal River Unit 3 (See Note 4),
• A $121 million increase in Fuel used in electric generation and purchased
power primarily due to the impact of establishing a regulatory liability
for replacement power in accordance with the 2012 FPSC settlement
agreement (See Note 4), and an increase in deferred fuel expense
related to higher under-recovered fuel costs in 2011 as a result of higher
system requirements driven by favorable weather in the prior year. These
increases were partially offset by lower natural gas prices and lower
system requirements as a result of unfavorable weather conditions in the
current year and a lower Crystal River Unit 3 indemnifi cation charge for
the estimated joint owner replacement power costs,
• An $86 million increase in Operation and maintenance expenses primarily
due to higher costs to achieve the merger with Duke Energy, and
• A $23 million increase in Depreciation and amortization primarily due to a
decrease in the reduction of the cost of removal component of amortization
expense as allowed under the 2012 and 2010 settlement agreements
(See Note 4) and higher Environmental Cost Recovery Clause (ECRC)
amortization due to less over-recovery, partially offset by lower nuclear cost-
recovery amortization primarily related to the Levy nuclear station project.
Interest Expense.
The variance was primarily due to the prior-year favorable settlement of
2004 and 2005 income tax audits.
Income Tax Expense.
The variance was primarily due to a decrease in pretax net income. The
effective tax rate for the years ended December 31, 2012 and 2011 were 35.7%
and 36.3%, respectively.
Matters Impacting Future Progress Energy Florida’s Results
In accordance with the terms of the 2012 FPSC Settlement Agreement,
with consumer representatives and approved by the FPSC, Progress Energy
Florida retains the sole discretion and fl exibility to retire Crystal River Unit 3.
As a result of the decision to retire Crystal River Unit 3, under the terms of
the 2012 FPSC Settlement Agreement, Progress Energy Florida is allowed to
recover all remaining Crystal River Unit 3 investments and to earn a return
on the Crystal River Unit 3 investments set at its current authorized overall
cost of capital, adjusted to refl ect a return on equity set at 70 percent of the
current FPSC authorized return on equity, no earlier than the fi rst billing cycle
of January 2017. Progress Energy Florida expects that the FPSC will review
the prudence of the retirement decision in Phase 2 of the Crystal River Unit
3 delamination regulatory docket. Progress Energy Florida has also asked the
FPSC to review the mediated resolution of insurance claims with NEIL as part
of Phase 3 of this regulatory docket. Phase 2 and Phase 3 hearings have been
tentatively scheduled to begin on June 19, 2013. Progress Energy Florida’s
fi nancial condition and results of operations could be adversely impacted if the
FPSC issues an unfavorable ruling.
The ability to integrate with Duke Energy businesses and realize cost
savings and any other synergies expected from the merger with Duke Energy
could be different from what Progress Energy Florida expects and may have a
signifi cant impact on Progress Energy Florida’s results of operations.