Duke Energy 2012 Annual Report Download - page 228
Download and view the complete annual report
Please find page 228 of the 2012 Duke Energy annual report below. You can navigate through the pages in the report by either clicking on the pages listed below, or by using the keyword search tool below to find specific information within the annual report.-
 1
1 -
2
-
3
-
4
-
5
-
6
-
7
-
8
-
9
-
10
-
11
-
12
-
13
-
14
-
15
-
16
-
17
-
18
-
19
-
20
-
21
-
22
-
23
-
24
-
25
-
26
-
27
-
28
-
29
-
30
-
31
-
32
-
33
-
34
-
35
-
36
-
37
-
38
-
39
-
40
-
41
-
42
-
43
-
44
-
45
-
46
-
47
-
48
-
49
-
50
-
51
-
52
-
53
-
54
-
55
-
56
-
57
-
58
-
59
-
60
-
61
-
62
-
63
-
64
-
65
-
66
-
67
-
68
-
69
-
70
-
71
-
72
-
73
-
74
-
75
-
76
-
77
-
78
-
79
-
80
-
81
-
82
-
83
-
84
-
85
-
86
-
87
-
88
-
89
-
90
-
91
-
92
-
93
-
94
-
95
-
96
-
97
-
98
-
99
-
100
-
101
-
102
-
103
-
104
-
105
-
106
-
107
-
108
-
109
-
110
-
111
-
112
-
113
-
114
-
115
-
116
-
117
-
118
-
119
-
120
-
121
-
122
-
123
-
124
-
125
-
126
-
127
-
128
-
129
-
130
-
131
-
132
-
133
-
134
-
135
-
136
-
137
-
138
-
139
-
140
-
141
-
142
-
143
-
144
-
145
-
146
-
147
-
148
-
149
-
150
-
151
-
152
-
153
-
154
-
155
-
156
-
157
-
158
-
159
-
160
-
161
-
162
-
163
-
164
-
165
-
166
-
167
-
168
-
169
-
170
-
171
-
172
-
173
-
174
-
175
-
176
-
177
-
178
-
179
-
180
-
181
-
182
-
183
-
184
-
185
-
186
-
187
-
188
-
189
-
190
-
191
-
192
-
193
-
194
-
195
-
196
-
197
-
198
-
199
-
200
-
201
-
202
-
203
-
204
-
205
-
206
-
207
-
208
-
209
-
210
-
211
-
212
-
213
-
214
-
215
-
216
-
217
-
 218
218 -
 219
219 -
 220
220 -
 221
221 -
 222
222 -
 223
223 -
 224
224 -
 225
225 -
 226
226 -
 227
227 -
 228
228 -
 229
229 -
 230
230 -
 231
231 -
 232
232 -
 233
233 -
 234
234 -
 235
235 -
 236
236 -
 237
237 -
 238
238 -
239
-
240
-
241
-
242
-
243
-
244
-
245
-
246
-
247
-
248
-
249
-
250
-
251
-
252
-
253
-
254
-
255
-
256
-
257
-
258
-
259
-
260
-
261
-
262
-
263
-
264
-
265
-
266
-
267
-
268
-
269
-
270
-
271
-
272
-
273
-
274
-
275
-
276
-
277
-
278
-
279
-
280
-
281
-
282
-
283
-
284
-
285
-
286
-
287
-
288
-
289
-
290
-
291
-
292
-
293
-
294
-
295
-
296
-
297
-
298
-
299
-
300
-
301
-
302
-
303
-
304
-
305
-
306
-
307
-
308
 |
 |

208
PART II
DUKE ENERGY CORPORATION • DUKE ENERGY CAROLINAS, LLC • PROGRESS ENERGY, INC. • CAROLINA POWER & LIGHT COMPANY d/b/a PROGRESS
ENERGY CAROLINAS, INC. • FLORIDA POWER CORPORATION d/b/a PROGRESS ENERY FLORIDA, INC. • DUKE ENERGY OHIO, INC. • DUKE ENERGY INDIANA, INC.
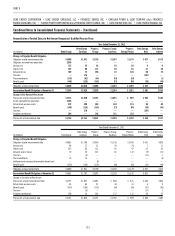
Combined Notes to Consolidated Financial Statements – (Continued)
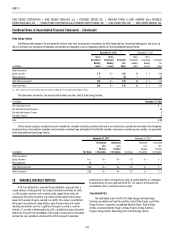
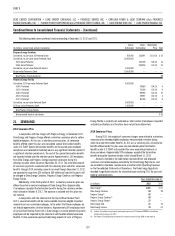
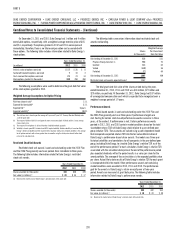
Amounts included in the table below represent the severance liability for
past and ongoing severance plans. Amounts for Subsidiary Registrants do not
include allocated expense or associated cash payments. Amounts for Duke
Energy Ohio and Duke Energy Indiana are not material.
(in millions)
Balance at
December 31,
2011
Provision/
Adjustments
Cash
Reductions
Balance at
December 31,
2012
Duke Energy $ 32 $171 $(68) $135
Duke Energy Carolinas 1 21 (10) 12
Progress Energy 5 71 (33) 43
Progress Energy Carolinas 5 35 (17) 23
Progress Energy Florida — 12 (6) 6
As part of Duke Energy Carolinas’ 2011 rate case, the NCUC approved
the recovery of $101 million of previously recorded expenses related to a prior
year Voluntary Opportunity Plan. This amount was recorded as a reduction
to Operation, maintenance, and other within Operating Expenses on the
Consolidated Statements of Operations and recognized as a Regulatory asset on
the Consolidated Balance Sheets in 2012.
22. STOCK-BASED COMPENSATION
For employee awards, equity classifi ed stock-based compensation cost
is measured at the service inception date or the grant date, based on the
estimated achievement of certain performance metrics or the fair value of the
award, and is recognized as expense or capitalized as a component of property,
plant and equipment over the requisite service period.
Duke Energy’s 2010 Long-Term Incentive Plan (the 2010 Plan) reserved
25 million shares of common stock for awards to employees and outside
directors. The 2010 Plan supersedes the 2006 Long-Term Incentive Plan, as
amended (the 2006 Plan), and no additional grants will be made from the 2006
Plan. Under the 2010 Plan, the exercise price of each option granted cannot
be less than the market price of Duke Energy’s common stock on the date of
grant and the maximum option term is 10 years. The vesting periods range
from immediate to three years. Duke Energy has historically issued new shares
upon exercising or vesting of share-based awards. In 2013, Duke Energy may
use a combination of new share issuances and open market repurchases for
share-based awards that are exercised or become vested; however, Duke
Energy has not determined with certainty the amount of such new share
issuances or open market repurchases.
The 2010 Plan allows for a maximum of 6.25 million shares of common
stock to be issued under various stock-based awards other than options and
stock appreciation rights.
In connection with the acquisition of Progress Energy in July 2012, Duke
Energy assumed Progress Energy’s 1997 Equity Incentive Plan (EIP), which was
continued under the 2002 and 2007 EIPs, as amended and restated from time
to time. Stock-based awards granted under the Progress Energy EIPs and held
by Progress Energy employees were generally converted into outstanding Duke
Energy stock-based compensation awards with the estimated fair value of
the awards allocated to purchase price determined to be $62 million. Refer to
Note 2 for further information regarding the merger transaction.
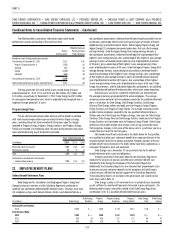
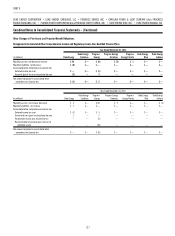
Stock-Based Compensation Expense
The following table summarizes the total expense recognized by each of
the Duke Energy Registrants, net of tax, for stock-based compensation.
Years Ended December 31,
(in millions) 2012 2011 2010
Duke Energy $ 48 $32 $41
Duke Energy Carolinas 12 17 23
Progress Energy 25 20 16
Progress Energy Carolinas 16 12 10
Progress Energy Florida 9 8 7
Duke Energy Ohio 4 6 7
Duke Energy Indiana 4 4 6
Duke Energy Plans
Pre-tax stock-based compensation costs, tax benefi t associated
with stock-based compensation expense, and the amount of stock-based
compensation costs capitalized related to the Duke Energy plans are included in
the following table.
Years Ended December 31,
(in millions) 2012 2011 2010
Stock Options $ 2 $ 2 $ 2
Restricted Stock Unit Awards 43 27 26
Performance Awards 33 23 39
Total $ 78 $52 $67
Tax benefi t associated with stock-based
compensation expense $30 $20 $26
Stock-based compensation costs capitalized 2 2 4
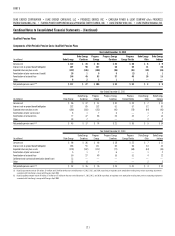
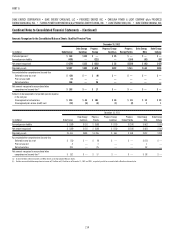
Stock Option Activity
Options
(in thousands)
Weighted-
Average
Exercise
Price
Weighted-
Average
Remaining
Life
(in years)
Aggregate
Intrinsic
Value
(in millions)
Outstanding at
December 31, 2011
2,089 $46
Progress Energy transfers in(a) 94 50
Granted 340 63
Exercised (580) 36
Forfeited or expired (289) 65
Outstanding at
December 31, 2012 1,654 51 6.3 $22
Exercisable at
December 31, 2012 953 45 4.8 17
Options expected to vest 701 58 8.5 4
(a) Progress Energy had an insignifi cant number of stock options outstanding as of and for the years ended
December 31, 2011 and 2010.