Duke Energy 2012 Annual Report Download - page 117
Download and view the complete annual report
Please find page 117 of the 2012 Duke Energy annual report below. You can navigate through the pages in the report by either clicking on the pages listed below, or by using the keyword search tool below to find specific information within the annual report.-
 1
1 -
2
-
3
-
4
-
5
-
6
-
7
-
8
-
9
-
10
-
11
-
12
-
13
-
14
-
15
-
16
-
17
-
18
-
19
-
20
-
21
-
22
-
23
-
24
-
25
-
26
-
27
-
28
-
29
-
30
-
31
-
32
-
33
-
34
-
35
-
36
-
37
-
38
-
39
-
40
-
41
-
42
-
43
-
44
-
45
-
46
-
47
-
48
-
49
-
50
-
51
-
52
-
53
-
54
-
55
-
56
-
57
-
58
-
59
-
60
-
61
-
62
-
63
-
64
-
65
-
66
-
67
-
68
-
69
-
70
-
71
-
72
-
73
-
74
-
75
-
76
-
77
-
78
-
79
-
80
-
81
-
82
-
83
-
84
-
85
-
86
-
87
-
88
-
89
-
90
-
91
-
92
-
93
-
94
-
95
-
96
-
97
-
98
-
99
-
100
-
101
-
102
-
103
-
104
-
105
-
106
-
 107
107 -
 108
108 -
 109
109 -
 110
110 -
 111
111 -
 112
112 -
 113
113 -
 114
114 -
 115
115 -
 116
116 -
 117
117 -
 118
118 -
 119
119 -
 120
120 -
 121
121 -
 122
122 -
 123
123 -
 124
124 -
 125
125 -
 126
126 -
 127
127 -
128
-
129
-
130
-
131
-
132
-
133
-
134
-
135
-
136
-
137
-
138
-
139
-
140
-
141
-
142
-
143
-
144
-
145
-
146
-
147
-
148
-
149
-
150
-
151
-
152
-
153
-
154
-
155
-
156
-
157
-
158
-
159
-
160
-
161
-
162
-
163
-
164
-
165
-
166
-
167
-
168
-
169
-
170
-
171
-
172
-
173
-
174
-
175
-
176
-
177
-
178
-
179
-
180
-
181
-
182
-
183
-
184
-
185
-
186
-
187
-
188
-
189
-
190
-
191
-
192
-
193
-
194
-
195
-
196
-
197
-
198
-
199
-
200
-
201
-
202
-
203
-
204
-
205
-
206
-
207
-
208
-
209
-
210
-
211
-
212
-
213
-
214
-
215
-
216
-
217
-
218
-
219
-
220
-
221
-
222
-
223
-
224
-
225
-
226
-
227
-
228
-
229
-
230
-
231
-
232
-
233
-
234
-
235
-
236
-
237
-
238
-
239
-
240
-
241
-
242
-
243
-
244
-
245
-
246
-
247
-
248
-
249
-
250
-
251
-
252
-
253
-
254
-
255
-
256
-
257
-
258
-
259
-
260
-
261
-
262
-
263
-
264
-
265
-
266
-
267
-
268
-
269
-
270
-
271
-
272
-
273
-
274
-
275
-
276
-
277
-
278
-
279
-
280
-
281
-
282
-
283
-
284
-
285
-
286
-
287
-
288
-
289
-
290
-
291
-
292
-
293
-
294
-
295
-
296
-
297
-
298
-
299
-
300
-
301
-
302
-
303
-
304
-
305
-
306
-
307
-
308
 |
 |

97
PART II
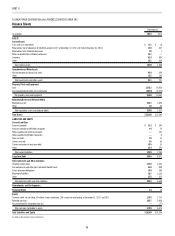
FLORIDA POWER CORPORATION d/b/a PROGRESS ENERGY FLORIDA, INC.
Statements of Cash Flows
Years Ended December 31,
(in millions) 2012 2011 2010
CASH FLOWS FROM OPERATING ACTIVITIES
Net income $ 266 $ 314 $ 453
Adjustments to reconcile net income to net cash provided by operating activities:
Depreciation, amortization and accretion 197 174 430
Equity component of AFUDC (37) (32) (28)
Severance expense 6 — —
Gains (losses) on sales of other assets and other, net (2) (2) 5
Impairment charges 146 — —
Deferred income taxes 142 234 324
Amount to be refunded to customers 100 288 —
Accrued pension and other post-retirement benefi t costs 71 52 58
Contributions to qualifi ed pension plans (128) (112) (34)
(Increase) decrease in
Net realized and unrealized mark-to-market and hedging transactions 73 (13) (7)
Receivables 37 91 (95)
Receivables from affi liated companies (13) (6) (1)
Inventory (13) (28) 6
Other current assets 22 (160) (85)
Increase (decrease) in
Accounts payable 21 (45) 76
Accounts payable to affi liated companies 30 (37) (4)
Taxes accrued 15 (8) 53
Other current liabilities 51 16 45
Other assets 8 (7) 1
Other liabilities (94) 46 7
Net cash provided by operating activities 898 765 1,204
CASH FLOWS FROM INVESTING ACTIVITIES
Capital expenditures (809) (813) (1,055)
Purchases of available-for-sale securities (791) (4,435) (6,386)
Proceeds from sales and maturities of available-for-sale securities 791 4,438 6,390
Insurance proceeds 7 76 64
Notes receivable from affi liated companies (207) — —
Other 9 27 —
Net cash used in investing activities (1,000) (707) (987)
CASH FLOWS FROM FINANCING ACTIVITIES
Proceeds from the issuance of long-term debt 642 296 591
Payments for the redemption of long-term debt (10) (309) (308)
Payments of short-term debt with original maturities greater than 90 days (65) — —
Proceeds from issuance of short-term debt with original maturities greater than 90 days 65 — —
Notes payable and commercial paper (233) 233 —
Notes payable to affi liated companies (8) — (212)
Dividends paid to parent (170) (510) (50)
Dividends paid on preferred stock (2) (2) (2)
Other (2) 1 (4)
Net cash provided by (used in) fi nancing activities 217 (291) 15
Net increase (decrease) in cash and cash equivalents 115 (233) 232
Cash and cash equivalents at beginning of period 16 249 17
Cash and cash equivalents at end of period $ 131 $ 16 $ 249
Supplemental Disclosures
Cash paid for interest, net of amount capitalized $ 266 $ 287 $ 241
Cash paid for (received from) income taxes $ 24 $ (83) $ (98)
Signifi cant non-cash transactions:
Accrued capital expenditures $ 139 $ 106 $ 112
Asset retirement obligation additions and estimate revisions $ 139 $ — $ (19)
See Notes to Consolidated Financial Statements