Duke Energy 2012 Annual Report Download - page 144
Download and view the complete annual report
Please find page 144 of the 2012 Duke Energy annual report below. You can navigate through the pages in the report by either clicking on the pages listed below, or by using the keyword search tool below to find specific information within the annual report.-
 1
1 -
2
-
3
-
4
-
5
-
6
-
7
-
8
-
9
-
10
-
11
-
12
-
13
-
14
-
15
-
16
-
17
-
18
-
19
-
20
-
21
-
22
-
23
-
24
-
25
-
26
-
27
-
28
-
29
-
30
-
31
-
32
-
33
-
34
-
35
-
36
-
37
-
38
-
39
-
40
-
41
-
42
-
43
-
44
-
45
-
46
-
47
-
48
-
49
-
50
-
51
-
52
-
53
-
54
-
55
-
56
-
57
-
58
-
59
-
60
-
61
-
62
-
63
-
64
-
65
-
66
-
67
-
68
-
69
-
70
-
71
-
72
-
73
-
74
-
75
-
76
-
77
-
78
-
79
-
80
-
81
-
82
-
83
-
84
-
85
-
86
-
87
-
88
-
89
-
90
-
91
-
92
-
93
-
94
-
95
-
96
-
97
-
98
-
99
-
100
-
101
-
102
-
103
-
104
-
105
-
106
-
107
-
108
-
109
-
110
-
111
-
112
-
113
-
114
-
115
-
116
-
117
-
118
-
119
-
120
-
121
-
122
-
123
-
124
-
125
-
126
-
127
-
128
-
129
-
130
-
131
-
132
-
133
-
 134
134 -
 135
135 -
 136
136 -
 137
137 -
 138
138 -
 139
139 -
 140
140 -
 141
141 -
 142
142 -
 143
143 -
 144
144 -
 145
145 -
 146
146 -
 147
147 -
 148
148 -
 149
149 -
 150
150 -
 151
151 -
 152
152 -
 153
153 -
 154
154 -
155
-
156
-
157
-
158
-
159
-
160
-
161
-
162
-
163
-
164
-
165
-
166
-
167
-
168
-
169
-
170
-
171
-
172
-
173
-
174
-
175
-
176
-
177
-
178
-
179
-
180
-
181
-
182
-
183
-
184
-
185
-
186
-
187
-
188
-
189
-
190
-
191
-
192
-
193
-
194
-
195
-
196
-
197
-
198
-
199
-
200
-
201
-
202
-
203
-
204
-
205
-
206
-
207
-
208
-
209
-
210
-
211
-
212
-
213
-
214
-
215
-
216
-
217
-
218
-
219
-
220
-
221
-
222
-
223
-
224
-
225
-
226
-
227
-
228
-
229
-
230
-
231
-
232
-
233
-
234
-
235
-
236
-
237
-
238
-
239
-
240
-
241
-
242
-
243
-
244
-
245
-
246
-
247
-
248
-
249
-
250
-
251
-
252
-
253
-
254
-
255
-
256
-
257
-
258
-
259
-
260
-
261
-
262
-
263
-
264
-
265
-
266
-
267
-
268
-
269
-
270
-
271
-
272
-
273
-
274
-
275
-
276
-
277
-
278
-
279
-
280
-
281
-
282
-
283
-
284
-
285
-
286
-
287
-
288
-
289
-
290
-
291
-
292
-
293
-
294
-
295
-
296
-
297
-
298
-
299
-
300
-
301
-
302
-
303
-
304
-
305
-
306
-
307
-
308
 |
 |

124
PART II
Combined Notes to Consolidated Financial Statements – (Continued)
DUKE ENERGY CORPORATION • DUKE ENERGY CAROLINAS, LLC • PROGRESS ENERGY, INC. • CAROLINA POWER & LIGHT COMPANY d/b/a PROGRESS ENERGY
CAROLINAS, INC. • FLORIDA POWER CORPORATION d/b/a PROGRESS ENERY FLORIDA, INC. • DUKE ENERGY OHIO, INC. • DUKE ENERGY INDIANA, INC.
Generation Services, Inc. and its affi liates (DEGS), Commercial Power engages
in the development, construction and operation of renewable energy projects. In
addition, DEGS develops commercial transmission projects.
International Energy principally operates and manages power generation
facilities and engages in sales and marketing of electric power and natural
gas outside the U.S. It conducts operations primarily through Duke Energy
International, LLC and its affi liates and its activities principally target power
generation in Latin America. Additionally, International Energy owns a 25%
interest in National Methanol Company, located in Saudi Arabia, which is a large
regional producer of methanol and methyl tertiary butyl ether.
The remainder of Duke Energy’s operations is presented as Other. While
it is not considered an operating segment, Other primarily includes unallocated
corporate costs, which include costs not allocable to Duke Energy’s reportable
business segments, primarily interest expense on corporate debt instruments,
costs to achieve mergers and divestitures, and costs associated with certain
corporate severance programs. It also includes Bison Insurance Company
Limited (Bison), Duke Energy’s wholly owned, captive insurance subsidiary,
Duke Energy’s 50% interest in DukeNet and related telecommunications
businesses, and Duke Energy’s 60% interest in Duke Energy Trading and
Marketing, LLC.
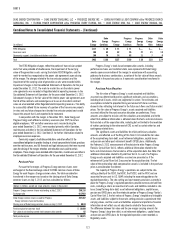
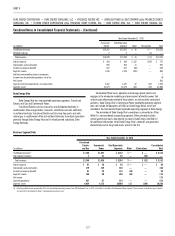
Business Segment Data
Year Ended December 31, 2012
(in millions) USFE&G
Commercial
Power
International
Energy
Total Reportable
Segments Other Eliminations Total
Unaffi liated revenues(a) $16,042 $2,020 $1,549 $ 19,611 $ 13 $ — $ 19,624
Intersegment revenues 38 58 — 96 47 (143) —
Total revenues $16,080 $2,078 $1,549 $ 19,707 $ 60 $(143) $ 19,624
Interest expense $ 806 $ 63 $ 77 $ 946 $ 296 $ — $ 1,242
Depreciation and amortization 1,827 228 99 2,154 135 — 2,289
Equity in earnings of unconsolidated affi liates (5) 14 134 143 5 — 148
Income tax expense (benefi t) 942 (8) 149 1,083 (378) — 705
Segment income(a)(b)(c) 1,744 87 439 2,270 (538) — 1,732
Add back noncontrolling interest component 14
Income from discontinued operations, net of tax 36
Net income 1,782
Capital investments expenditures and acquisitions 4,220 1,038 551 5,809 149 — 5,958
Segment assets 98,162 6,992 5,406 110,560 3,126 170 113,856
(a) On January 25, 2012 and January 27, 2012, the Duke Energy Carolinas’ South Carolina and North Carolina rate case settlement agreements were approved by the PSCSC and NCUC, respectively. Among other things, the rate
case settlements included an annual base rate increase of $309 million in North Carolina and a $93 million annual base rate increase in South Carolina, both beginning in February 2012. The impact of these rates impacts
USFE&G. See Note 4 for additional information.
(b) USFE&G recorded after-tax impairment and other charges of $402 million, net of tax of $226 million, related to the Edwardsport integrated gasifi cation combined cycle (IGCC) project. See Note 4 for additional information.
USFE&G also recorded the reversal of expenses of $60 million, net of tax of $39 million, related to a prior year Voluntary Opportunity Plan in accordance with Duke Energy Carolinas’ 2011 rate case. See Note 21 for additional
information.
(c) Other includes after-tax costs to achieve the merger with Progress Energy of $397 million, net of tax of $239 million. See Note 2 for additional information.
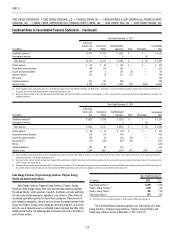
Year Ended December 31, 2011
(in millions) USFE&G
Commercial
Power
International
Energy
Total Reportable
Segments(a) Other Eliminations Total
Unaffi liated revenues $10,586 $ 2,480 $ 1,467 $ 14,533 $ (4) $ — $ 14,529
Intersegment revenues 33 11 — 44 48 (92) —
Total revenues $10,619 $ 2,491 $ 1,467 $ 14,577 $ 44 $ (92) $ 14,529
Interest expense $ 568 $ 87 $ 47 $ 702 $ 157 $ — $ 859
Depreciation and amortization 1,383 230 90 1,703 103 — 1,806
Equity in earnings of unconsolidated affi liates — 6 145 151 9 — 160
Income tax expense (benefi t) 674 (2) 196 868 (116) — 752
Segment income(a)(b)(c) 1,181 134 466 1,781 (76) — 1,705
Add back noncontrolling interest component 8
Income from discontinued operations, net of tax 1
Net income 1,714
Capital investments expenditures and acquisitions 3,717 492 114 4,323 141 — 4,464
Segment assets 47,977 6,939 4,539 59,455 2,961 110 62,526
(a) USFE&G recorded an after-tax impairment charge of $135 million, net of tax of $87 million, related to the Edwardsport IGCC project. See Note 4 for additional information.
(b) Commercial Power recorded an after-tax impairment charge of $51 million, net of tax of $28 million, to write-down the carrying value of certain emission allowances. See Note 12 for additional information.
(c) Other includes after-tax costs to achieve the merger with Progress Energy of $51 million, net of tax of $17 million. See Note 2 for additional information.