Duke Energy 2012 Annual Report Download - page 116
Download and view the complete annual report
Please find page 116 of the 2012 Duke Energy annual report below. You can navigate through the pages in the report by either clicking on the pages listed below, or by using the keyword search tool below to find specific information within the annual report.-
 1
1 -
2
-
3
-
4
-
5
-
6
-
7
-
8
-
9
-
10
-
11
-
12
-
13
-
14
-
15
-
16
-
17
-
18
-
19
-
20
-
21
-
22
-
23
-
24
-
25
-
26
-
27
-
28
-
29
-
30
-
31
-
32
-
33
-
34
-
35
-
36
-
37
-
38
-
39
-
40
-
41
-
42
-
43
-
44
-
45
-
46
-
47
-
48
-
49
-
50
-
51
-
52
-
53
-
54
-
55
-
56
-
57
-
58
-
59
-
60
-
61
-
62
-
63
-
64
-
65
-
66
-
67
-
68
-
69
-
70
-
71
-
72
-
73
-
74
-
75
-
76
-
77
-
78
-
79
-
80
-
81
-
82
-
83
-
84
-
85
-
86
-
87
-
88
-
89
-
90
-
91
-
92
-
93
-
94
-
95
-
96
-
97
-
98
-
99
-
100
-
101
-
102
-
103
-
104
-
105
-
 106
106 -
 107
107 -
 108
108 -
 109
109 -
 110
110 -
 111
111 -
 112
112 -
 113
113 -
 114
114 -
 115
115 -
 116
116 -
 117
117 -
 118
118 -
 119
119 -
 120
120 -
 121
121 -
 122
122 -
 123
123 -
 124
124 -
 125
125 -
 126
126 -
127
-
128
-
129
-
130
-
131
-
132
-
133
-
134
-
135
-
136
-
137
-
138
-
139
-
140
-
141
-
142
-
143
-
144
-
145
-
146
-
147
-
148
-
149
-
150
-
151
-
152
-
153
-
154
-
155
-
156
-
157
-
158
-
159
-
160
-
161
-
162
-
163
-
164
-
165
-
166
-
167
-
168
-
169
-
170
-
171
-
172
-
173
-
174
-
175
-
176
-
177
-
178
-
179
-
180
-
181
-
182
-
183
-
184
-
185
-
186
-
187
-
188
-
189
-
190
-
191
-
192
-
193
-
194
-
195
-
196
-
197
-
198
-
199
-
200
-
201
-
202
-
203
-
204
-
205
-
206
-
207
-
208
-
209
-
210
-
211
-
212
-
213
-
214
-
215
-
216
-
217
-
218
-
219
-
220
-
221
-
222
-
223
-
224
-
225
-
226
-
227
-
228
-
229
-
230
-
231
-
232
-
233
-
234
-
235
-
236
-
237
-
238
-
239
-
240
-
241
-
242
-
243
-
244
-
245
-
246
-
247
-
248
-
249
-
250
-
251
-
252
-
253
-
254
-
255
-
256
-
257
-
258
-
259
-
260
-
261
-
262
-
263
-
264
-
265
-
266
-
267
-
268
-
269
-
270
-
271
-
272
-
273
-
274
-
275
-
276
-
277
-
278
-
279
-
280
-
281
-
282
-
283
-
284
-
285
-
286
-
287
-
288
-
289
-
290
-
291
-
292
-
293
-
294
-
295
-
296
-
297
-
298
-
299
-
300
-
301
-
302
-
303
-
304
-
305
-
306
-
307
-
308
 |
 |

96
PART II
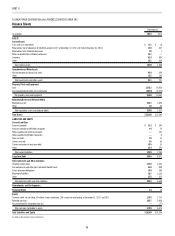
FLORIDA POWER CORPORATION d/b/a PROGRESS ENERGY FLORIDA, INC.
Balance Sheets
December 31,
(in millions) 2012 2011
ASSETS
Current Assets
Cash and cash equivalents $ 131 $ 16
Receivables (net of allowance for doubtful accounts of $7 at December 31, 2012 and $18 at December 31, 2011) 318 367
Receivables from affi liated companies 20 7
Notes receivable from affi liated companies 207 —
Inventory 613 659
Other 351 419
Total current assets 1,640 1,468
Investments and Other Assets
Nuclear decommissioning trust funds 629 559
Other 182 142
Total investments and other assets 811 701
Property, Plant and Equipment
Cost 13,432 14,926
Accumulated depreciation and amortization (4,072) (4,474)
Net property, plant and equipment 9,360 10,452
Regulatory Assets and Deferred Debits
Regulatory assets 3,321 1,629
Other 48 44
Total regulatory assets and deferred debits 3,369 1,673
Total Assets $15,180 $14,294
LIABILITIES AND EQUITY
Current Liabilities
Accounts payable $ 412 $ 340
Accounts payable to affi liated companies 44 14
Notes payable and commercial paper — 233
Notes payable to affi liated companies — 8
Taxes accrued 48 31
Interest accrued 55 54
Current maturities of long-term debt 435 10
Other 534 576
Total current liabilities 1,528 1,266
Long-term Debt 4,885 4,671
Deferred Credits and Other Liabilities
Deferred income taxes 1,518 1,325
Accrued pension and other post-retirement benefi t costs 610 598
Asset retirement obligations 764 369
Regulatory liabilities 787 1,024
Other 255 332
Total deferred credits and other liabilities 3,934 3,648
Commitments and Contingencies
Preferred Stock 34 34
Equity
Common stock, no par value, 60 million shares authorized, 100 issued and outstanding at December 31, 2012 and 2011 1,762 1,757
Retained earnings 3,037 2,945
Accumulated other comprehensive loss — (27)
Total common stockholder’s equity 4,799 4,675
Total Liabilities and Equity $15,180 $14,294
See Notes to Consolidated Financial Statements