Duke Energy 2012 Annual Report Download - page 100
Download and view the complete annual report
Please find page 100 of the 2012 Duke Energy annual report below. You can navigate through the pages in the report by either clicking on the pages listed below, or by using the keyword search tool below to find specific information within the annual report.-
 1
1 -
2
-
3
-
4
-
5
-
6
-
7
-
8
-
9
-
10
-
11
-
12
-
13
-
14
-
15
-
16
-
17
-
18
-
19
-
20
-
21
-
22
-
23
-
24
-
25
-
26
-
27
-
28
-
29
-
30
-
31
-
32
-
33
-
34
-
35
-
36
-
37
-
38
-
39
-
40
-
41
-
42
-
43
-
44
-
45
-
46
-
47
-
48
-
49
-
50
-
51
-
52
-
53
-
54
-
55
-
56
-
57
-
58
-
59
-
60
-
61
-
62
-
63
-
64
-
65
-
66
-
67
-
68
-
69
-
70
-
71
-
72
-
73
-
74
-
75
-
76
-
77
-
78
-
79
-
80
-
81
-
82
-
83
-
84
-
85
-
86
-
87
-
88
-
89
-
 90
90 -
 91
91 -
 92
92 -
 93
93 -
 94
94 -
 95
95 -
 96
96 -
 97
97 -
 98
98 -
 99
99 -
 100
100 -
 101
101 -
 102
102 -
 103
103 -
 104
104 -
 105
105 -
 106
106 -
 107
107 -
 108
108 -
 109
109 -
 110
110 -
111
-
112
-
113
-
114
-
115
-
116
-
117
-
118
-
119
-
120
-
121
-
122
-
123
-
124
-
125
-
126
-
127
-
128
-
129
-
130
-
131
-
132
-
133
-
134
-
135
-
136
-
137
-
138
-
139
-
140
-
141
-
142
-
143
-
144
-
145
-
146
-
147
-
148
-
149
-
150
-
151
-
152
-
153
-
154
-
155
-
156
-
157
-
158
-
159
-
160
-
161
-
162
-
163
-
164
-
165
-
166
-
167
-
168
-
169
-
170
-
171
-
172
-
173
-
174
-
175
-
176
-
177
-
178
-
179
-
180
-
181
-
182
-
183
-
184
-
185
-
186
-
187
-
188
-
189
-
190
-
191
-
192
-
193
-
194
-
195
-
196
-
197
-
198
-
199
-
200
-
201
-
202
-
203
-
204
-
205
-
206
-
207
-
208
-
209
-
210
-
211
-
212
-
213
-
214
-
215
-
216
-
217
-
218
-
219
-
220
-
221
-
222
-
223
-
224
-
225
-
226
-
227
-
228
-
229
-
230
-
231
-
232
-
233
-
234
-
235
-
236
-
237
-
238
-
239
-
240
-
241
-
242
-
243
-
244
-
245
-
246
-
247
-
248
-
249
-
250
-
251
-
252
-
253
-
254
-
255
-
256
-
257
-
258
-
259
-
260
-
261
-
262
-
263
-
264
-
265
-
266
-
267
-
268
-
269
-
270
-
271
-
272
-
273
-
274
-
275
-
276
-
277
-
278
-
279
-
280
-
281
-
282
-
283
-
284
-
285
-
286
-
287
-
288
-
289
-
290
-
291
-
292
-
293
-
294
-
295
-
296
-
297
-
298
-
299
-
300
-
301
-
302
-
303
-
304
-
305
-
306
-
307
-
308
 |
 |

80
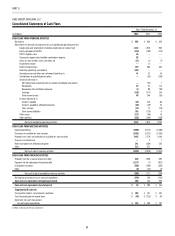
PART II
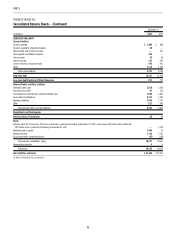
Years Ended December 31,
(in millions) 2012 2011 2010
CASH FLOWS FROM OPERATING ACTIVITIES
Net income $ 865 $ 834 $ 838
Adjustments to reconcile net income to net cash provided by operating activities:
Depreciation and amortization (including amortization of nuclear fuel) 1,143 1,020 984
Equity component of AFUDC (154) (168) (174)
FERC mitigation costs 46 — —
Community support and charitable contributions expense 56 — —
Gains on sales of other assets and other, net (12) (1) (7)
Impairment charges — 12 —
Deferred income taxes 479 564 456
Voluntary opportunity cost deferral (101) — —
Accrued pension and other post-retirement benefi t costs 41 32 34
Contributions to qualifi ed pension plans — (33) (158)
(Increase) decrease in
Net realized and unrealized mark-to-market and hedging transactions — (91) 1
Receivables 22 22 114
Receivables from affi liated companies (1) 88 (90)
Inventory (128) (177) 134
Other current assets 46 144 (55)
Increase (decrease) in
Accounts payable (51) 120 86
Accounts payable to affi liated companies (28) (39) 25
Taxes accrued (12) 12 (23)
Other current liabilities 165 (170) 4
Other assets (117) (46) 19
Other liabilities (126) (249) (158)
Net cash provided by operating activities 2,133 1,874 2,030
CASH FLOWS FROM INVESTING ACTIVITIES
Capital expenditures (1,908) (2,272) (2,280)
Purchases of available-for-sale securities (2,481) (2,227) (1,045)
Proceeds from sales and maturities of available-for-sale securities 2,445 2,179 1,066
Change in restricted cash — 2 7
Notes receivable from affi liated companies 541 (584) 250
Other (12) (13) —
Net cash used in investing activities (1,415) (2,915) (2,002)
CASH FLOWS FROM FINANCING ACTIVITIES
Proceeds from the issuance of long-term debt 645 1,498 692
Payments for the redemption of long-term debt (1,177) (7) (607)
Distributions to parent (450) (299) (350)
Other (6) (15) (4)
Net cash (used in) provided by fi nancing activities (988) 1,177 (269)
Net (decrease) increase in cash and cash equivalents (270) 136 (241)
Cash and cash equivalents at beginning of period 289 153 394
Cash and cash equivalents at end of period $ 19 $ 289 $ 153
Supplemental Disclosures
Cash paid for interest, net of amount capitalized $ 385 $ 337 $ 342
Cash (received) paid for income taxes $ (38) $ (223) $ 69
Signifi cant non-cash transactions:
Accrued capital expenditures $ 194 $ 209 $ 181
See Notes to Consolidated Financial Statements
DUKE ENERGY CAROLINAS, LLC
Consolidated Statements of Cash Flows