Duke Energy 2012 Annual Report Download - page 7
Download and view the complete annual report
Please find page 7 of the 2012 Duke Energy annual report below. You can navigate through the pages in the report by either clicking on the pages listed below, or by using the keyword search tool below to find specific information within the annual report.-
 1
1 -
 2
2 -
 3
3 -
 4
4 -
 5
5 -
 6
6 -
 7
7 -
 8
8 -
 9
9 -
 10
10 -
 11
11 -
 12
12 -
 13
13 -
 14
14 -
 15
15 -
 16
16 -
 17
17 -
 18
18 -
19
-
20
-
21
-
22
-
23
-
24
-
25
-
26
-
27
-
28
-
29
-
30
-
31
-
32
-
33
-
34
-
35
-
36
-
37
-
38
-
39
-
40
-
41
-
42
-
43
-
44
-
45
-
46
-
47
-
48
-
49
-
50
-
51
-
52
-
53
-
54
-
55
-
56
-
57
-
58
-
59
-
60
-
61
-
62
-
63
-
64
-
65
-
66
-
67
-
68
-
69
-
70
-
71
-
72
-
73
-
74
-
75
-
76
-
77
-
78
-
79
-
80
-
81
-
82
-
83
-
84
-
85
-
86
-
87
-
88
-
89
-
90
-
91
-
92
-
93
-
94
-
95
-
96
-
97
-
98
-
99
-
100
-
101
-
102
-
103
-
104
-
105
-
106
-
107
-
108
-
109
-
110
-
111
-
112
-
113
-
114
-
115
-
116
-
117
-
118
-
119
-
120
-
121
-
122
-
123
-
124
-
125
-
126
-
127
-
128
-
129
-
130
-
131
-
132
-
133
-
134
-
135
-
136
-
137
-
138
-
139
-
140
-
141
-
142
-
143
-
144
-
145
-
146
-
147
-
148
-
149
-
150
-
151
-
152
-
153
-
154
-
155
-
156
-
157
-
158
-
159
-
160
-
161
-
162
-
163
-
164
-
165
-
166
-
167
-
168
-
169
-
170
-
171
-
172
-
173
-
174
-
175
-
176
-
177
-
178
-
179
-
180
-
181
-
182
-
183
-
184
-
185
-
186
-
187
-
188
-
189
-
190
-
191
-
192
-
193
-
194
-
195
-
196
-
197
-
198
-
199
-
200
-
201
-
202
-
203
-
204
-
205
-
206
-
207
-
208
-
209
-
210
-
211
-
212
-
213
-
214
-
215
-
216
-
217
-
218
-
219
-
220
-
221
-
222
-
223
-
224
-
225
-
226
-
227
-
228
-
229
-
230
-
231
-
232
-
233
-
234
-
235
-
236
-
237
-
238
-
239
-
240
-
241
-
242
-
243
-
244
-
245
-
246
-
247
-
248
-
249
-
250
-
251
-
252
-
253
-
254
-
255
-
256
-
257
-
258
-
259
-
260
-
261
-
262
-
263
-
264
-
265
-
266
-
267
-
268
-
269
-
270
-
271
-
272
-
273
-
274
-
275
-
276
-
277
-
278
-
279
-
280
-
281
-
282
-
283
-
284
-
285
-
286
-
287
-
288
-
289
-
290
-
291
-
292
-
293
-
294
-
295
-
296
-
297
-
298
-
299
-
300
-
301
-
302
-
303
-
304
-
305
-
306
-
307
-
308
 |
 |

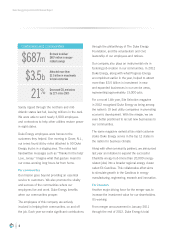
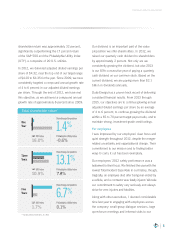
shareholder return was approximately 32 percent,
significantly outperforming the 17 percent return
of the S&P 500 and the Philadelphia Utility Index
(UTY), a composite of 20 U.S. utilities.
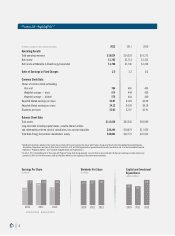
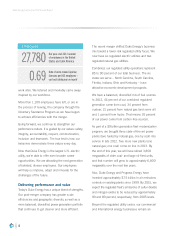
In 2012, we delivered adjusted diluted earnings per
share of $4.32, near the top end of our target range
of $4.20 to $4.35 for the year. Since 2009, we have
consistently targeted a compound annual growth rate
of 4 to 6 percent in our adjusted diluted earnings
per share. Through the end of 2012, we have met
this objective, as we achieved a compound annual
growth rate of approximately 6 percent since 2009.
Our dividend is an important part of the value
proposition we offer shareholders. In 2012, we
raised our quarterly cash dividend to shareholders
by approximately 2 percent. Not only are we
consistently growing the dividend, but also 2013
is our 87th consecutive year of paying a quarterly
cash dividend on our common stock. Based on the
current dividend, we are paying more than $2.1
billion in dividends annually.
Duke Energy has a proven track record of delivering
consistent financial results. From 2013 through
2015, our objectives are to continue growing annual
adjusted diluted earnings per share by an average
of 4 to 6 percent, to continue growing the dividend
within a 65 to 70 percent target payout ratio, and to
maintain strong, investment-grade credit ratings.
For employees
I was impressed by our employees’ clear focus and
quiet strength throughout 2012, despite the merger-
related uncertainty and organizational change. Their
commitment to our mission and to finding better
ways to carry it out has been exemplary.
Our employees’ 2012 safety performance was a
testament to their focus. We finished the year with the
lowest Total Incident Case Rate in our history, though,
tragically, an employee died after being rear-ended by
a vehicle, and a contractor was fatally injured. We take
our commitment to safety very seriously and always
strive for zero injuries and fatalities.
Along with other executives, I devoted considerable
time last year to engaging with employees across
the company: small-group dialogue sessions, large
open-forum meetings and informal visits to our
Five
Years
6.7%
Duke Energy Corporation
S&P
500
Index
1.7%
Philadelphia
Utility
Index
0.1%
Three
Years
13.1%
Duke Energy Corporation
S&P
500
Index
10.9%
Philadelphia
Utility
Index
7. 8 %
Total shareholder return*
* For the periods ended Dec. 31, 2012
One
Year
1.4%
Duke Energy Corporation
S&P
500
Index
16.0%
Philadelphia
Utility
Index
-0.6%
Chairman’s Letter to Stakeholders
5