Duke Energy 2012 Annual Report Download - page 17
Download and view the complete annual report
Please find page 17 of the 2012 Duke Energy annual report below. You can navigate through the pages in the report by either clicking on the pages listed below, or by using the keyword search tool below to find specific information within the annual report.-
 1
1 -
2
-
3
-
4
-
5
-
6
-
 7
7 -
 8
8 -
 9
9 -
 10
10 -
 11
11 -
 12
12 -
 13
13 -
 14
14 -
 15
15 -
 16
16 -
 17
17 -
 18
18 -
 19
19 -
 20
20 -
 21
21 -
 22
22 -
 23
23 -
 24
24 -
 25
25 -
 26
26 -
 27
27 -
28
-
29
-
30
-
31
-
32
-
33
-
34
-
35
-
36
-
37
-
38
-
39
-
40
-
41
-
42
-
43
-
44
-
45
-
46
-
47
-
48
-
49
-
50
-
51
-
52
-
53
-
54
-
55
-
56
-
57
-
58
-
59
-
60
-
61
-
62
-
63
-
64
-
65
-
66
-
67
-
68
-
69
-
70
-
71
-
72
-
73
-
74
-
75
-
76
-
77
-
78
-
79
-
80
-
81
-
82
-
83
-
84
-
85
-
86
-
87
-
88
-
89
-
90
-
91
-
92
-
93
-
94
-
95
-
96
-
97
-
98
-
99
-
100
-
101
-
102
-
103
-
104
-
105
-
106
-
107
-
108
-
109
-
110
-
111
-
112
-
113
-
114
-
115
-
116
-
117
-
118
-
119
-
120
-
121
-
122
-
123
-
124
-
125
-
126
-
127
-
128
-
129
-
130
-
131
-
132
-
133
-
134
-
135
-
136
-
137
-
138
-
139
-
140
-
141
-
142
-
143
-
144
-
145
-
146
-
147
-
148
-
149
-
150
-
151
-
152
-
153
-
154
-
155
-
156
-
157
-
158
-
159
-
160
-
161
-
162
-
163
-
164
-
165
-
166
-
167
-
168
-
169
-
170
-
171
-
172
-
173
-
174
-
175
-
176
-
177
-
178
-
179
-
180
-
181
-
182
-
183
-
184
-
185
-
186
-
187
-
188
-
189
-
190
-
191
-
192
-
193
-
194
-
195
-
196
-
197
-
198
-
199
-
200
-
201
-
202
-
203
-
204
-
205
-
206
-
207
-
208
-
209
-
210
-
211
-
212
-
213
-
214
-
215
-
216
-
217
-
218
-
219
-
220
-
221
-
222
-
223
-
224
-
225
-
226
-
227
-
228
-
229
-
230
-
231
-
232
-
233
-
234
-
235
-
236
-
237
-
238
-
239
-
240
-
241
-
242
-
243
-
244
-
245
-
246
-
247
-
248
-
249
-
250
-
251
-
252
-
253
-
254
-
255
-
256
-
257
-
258
-
259
-
260
-
261
-
262
-
263
-
264
-
265
-
266
-
267
-
268
-
269
-
270
-
271
-
272
-
273
-
274
-
275
-
276
-
277
-
278
-
279
-
280
-
281
-
282
-
283
-
284
-
285
-
286
-
287
-
288
-
289
-
290
-
291
-
292
-
293
-
294
-
295
-
296
-
297
-
298
-
299
-
300
-
301
-
302
-
303
-
304
-
305
-
306
-
307
-
308
 |
 |

Adjusted Segment Income
Duke Energy’s 2012 Annual Report includes a discussion of adjusted
segment income for the years ended December 31, 2012, 2011 and 2010.
The primary performance measure used by management to evaluate
segment performance is segment income. Segment income is dened
as income from continuing operations net of income attributable to
noncontrolling interests. In addition, direct interest expense and
income taxes are included in segment income and certain governance
costs are allocated to each of the segments. Management believes
segment income, which is a GAAP measure used to report segment
results, is a good indicator or each segment’s operating performance as it
represents the approximate net income contribution of Duke Energy’s
business segments by incorporating the direct nancing methods or
capital structures of the business segments as well as the income
tax attributes of the businesses and regions in which they operate.
Management also uses adjusted segment income as a measure of
historical and anticipated future segment performance. Adjusted
segment income is a non-GAAP nancial measure, as it is based
upon segment income adjusted for special items and the mark-to-
market impact of economic hedges in the Commercial Power segment.
Management believes that the presentation of adjusted segment
income provides useful information to investors, as it provides them
with an additional relevant comparison of a segment’s performance
across periods.
The most directly comparable GAAP measure for adjusted segment
income is reported segment income, which represents segment
income from continuing operations, including any special items and
the mark-to-market impact of economic hedges in the Commercial
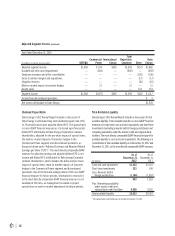
Power segment. The following is a reconciliation of adjusted segment
income to segment income for 2012, 2011 and 2010:
Year Ended December 31, 2012
Total
Commercial International Reportable Duke
(In millions, except per-share amounts) USFE&G Power Energy Segments Other Energy
Adjusted segment income $2,086 $93 $439 $2,618 $(135) $2,483
Edwardsport impairment and other charges (402) — — (402) — (402)
Costs to achieve mergers and acquisitions — — — — (397) (397)
Mark-to-market impact of economic hedges — (6) — (6) — (6)
Democratic National Convention Host Committee support — — — — (6) (6)
Employee severance and office consolidation 60 — — 60 — 60
Segment income $1,744 $87 $439 $2,270 $(538) $1,732
Income from discontinued operations $ 36
Net income attributable to Duke Energy $1,768
Year Ended December 31, 2011
Total
Commercial International Reportable Duke
(In millions, except per-share amounts) USFE&G Power Energy Segments Other Energy
Adjusted segment income $1,316 $186 $466 $1,968 $(25) $1,943
Edwardsport impairment and other charges (135) — — (135) — (135)
Emission allowance impairment — (51) — (51) — (51)
Costs to achieve mergers and acquisitions — — — — (51) (51)
Mark-to-market impact of economic hedges — (1) — (1) - (1)
Segment income $1,181 $134 $466 $1,781 $(76) $ 1,705
Income from discontinued operations $ 1
Net income attributable to Duke Energy $ 1,706
15