Duke Energy 2012 Annual Report Download - page 251
Download and view the complete annual report
Please find page 251 of the 2012 Duke Energy annual report below. You can navigate through the pages in the report by either clicking on the pages listed below, or by using the keyword search tool below to find specific information within the annual report.-
 1
1 -
2
-
3
-
4
-
5
-
6
-
7
-
8
-
9
-
10
-
11
-
12
-
13
-
14
-
15
-
16
-
17
-
18
-
19
-
20
-
21
-
22
-
23
-
24
-
25
-
26
-
27
-
28
-
29
-
30
-
31
-
32
-
33
-
34
-
35
-
36
-
37
-
38
-
39
-
40
-
41
-
42
-
43
-
44
-
45
-
46
-
47
-
48
-
49
-
50
-
51
-
52
-
53
-
54
-
55
-
56
-
57
-
58
-
59
-
60
-
61
-
62
-
63
-
64
-
65
-
66
-
67
-
68
-
69
-
70
-
71
-
72
-
73
-
74
-
75
-
76
-
77
-
78
-
79
-
80
-
81
-
82
-
83
-
84
-
85
-
86
-
87
-
88
-
89
-
90
-
91
-
92
-
93
-
94
-
95
-
96
-
97
-
98
-
99
-
100
-
101
-
102
-
103
-
104
-
105
-
106
-
107
-
108
-
109
-
110
-
111
-
112
-
113
-
114
-
115
-
116
-
117
-
118
-
119
-
120
-
121
-
122
-
123
-
124
-
125
-
126
-
127
-
128
-
129
-
130
-
131
-
132
-
133
-
134
-
135
-
136
-
137
-
138
-
139
-
140
-
141
-
142
-
143
-
144
-
145
-
146
-
147
-
148
-
149
-
150
-
151
-
152
-
153
-
154
-
155
-
156
-
157
-
158
-
159
-
160
-
161
-
162
-
163
-
164
-
165
-
166
-
167
-
168
-
169
-
170
-
171
-
172
-
173
-
174
-
175
-
176
-
177
-
178
-
179
-
180
-
181
-
182
-
183
-
184
-
185
-
186
-
187
-
188
-
189
-
190
-
191
-
192
-
193
-
194
-
195
-
196
-
197
-
198
-
199
-
200
-
201
-
202
-
203
-
204
-
205
-
206
-
207
-
208
-
209
-
210
-
211
-
212
-
213
-
214
-
215
-
216
-
217
-
218
-
219
-
220
-
221
-
222
-
223
-
224
-
225
-
226
-
227
-
228
-
229
-
230
-
231
-
232
-
233
-
234
-
235
-
236
-
237
-
238
-
239
-
240
-
 241
241 -
 242
242 -
 243
243 -
 244
244 -
 245
245 -
 246
246 -
 247
247 -
 248
248 -
 249
249 -
 250
250 -
 251
251 -
 252
252 -
 253
253 -
 254
254 -
 255
255 -
 256
256 -
 257
257 -
 258
258 -
 259
259 -
 260
260 -
 261
261 -
262
-
263
-
264
-
265
-
266
-
267
-
268
-
269
-
270
-
271
-
272
-
273
-
274
-
275
-
276
-
277
-
278
-
279
-
280
-
281
-
282
-
283
-
284
-
285
-
286
-
287
-
288
-
289
-
290
-
291
-
292
-
293
-
294
-
295
-
296
-
297
-
298
-
299
-
300
-
301
-
302
-
303
-
304
-
305
-
306
-
307
-
308
 |
 |

231
PART II
DUKE ENERGY CORPORATION • DUKE ENERGY CAROLINAS, LLC • PROGRESS ENERGY, INC. • CAROLINA POWER & LIGHT COMPANY d/b/a PROGRESS
ENERGY CAROLINAS, INC. • FLORIDA POWER CORPORATION d/b/a PROGRESS ENERY FLORIDA, INC. • DUKE ENERGY OHIO, INC. • DUKE ENERGY INDIANA, INC.
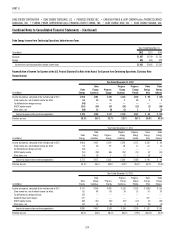
Combined Notes to Consolidated Financial Statements – (Continued)
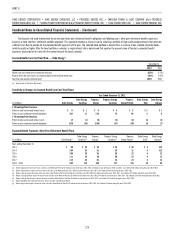
The following table provides a reconciliation of beginning and ending
balances of Master Trust assets measured at fair value on a recurring basis
where the determination of fair value includes signifi cant unobservable inputs
(Level 3).
(in millions) 2012 2011
Duke Energy Master Trust
Balance at January 1 $ 322 $ 185
Purchases, sales, issuances and settlements
Purchases 21 156
Sales (4) (29)
Total gains (losses) and other 13 10
Balance at December 31 $ 352 $ 322
The following table provides a reconciliation of beginning and ending
balances of Progress Trust assets measured at fair value on a recurring basis
where the determination of fair value includes signifi cant unobservable inputs
(Level 3).
(in millions) 2012 2011
Progress Energy Master Trust
Balance at January 1 $311 $160
Purchases, sales, issuances and settlements
Purchases 13 107
Sales (14) (13)
Transfers in and/or out of level 3 (41) —
Total gains (losses) and other 19 57
Balance at December 31 $288 $311
Valuation methods of the primary fair value measurements disclosed
above are as follows:
Investments in equity securities.
Investments in equity securities are typically valued at the closing price in
the principal active market as of the last business day of the quarter. Principal
active markets for equity prices include published exchanges such as NASDAQ
and NYSE. Foreign equity prices are translated from their trading currency using
the currency exchange rate in effect at the close of the principal active market.
Duke Energy has not adjusted prices to refl ect for after-hours market activity.
Most equity security valuations are Level 1 measures. Investments in equity
securities with unpublished prices are valued as Level 2 if they are redeemable
at the measurement date. Investments in equity securities with redemption
restrictions are valued as Level 3.
Investments in corporate bonds and U.S. government securities.
Most debt investments are valued based on a calculation using interest
rate curves and credit spreads applied to the terms of the debt instrument
(maturity and coupon interest rate) and consider the counterparty credit rating.
Most debt valuations are Level 2 measures. If the market for a particular fi xed
income security is relatively inactive or illiquid, the measurement is a Level 3
measurement.
Investments in short-term investment funds.
Investments in short-term investment funds are valued at the net
asset value of units held at year end. Investments in short-term investment
funds with published prices are valued as Level 1. Investments in short-term
investment funds with unpublished prices are valued as Level 2.
Investments in real estate investment trusts.
Investments in real estate investment trusts are valued based upon
property appraisal reports prepared by independent real estate appraisers. The
Chief Real Estate Appraiser of the asset manager is responsible for assuring
that the valuation process provides independent and reasonable property
market value estimates. An external appraisal management fi rm not affi liated
with the asset manager has been appointed to assist the Chief Real Estate
Appraiser in maintaining and monitoring the independence and the accuracy of
the appraisal process.
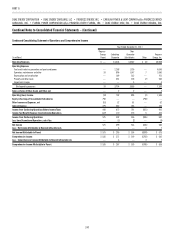
Employee Savings Plans
Duke Energy and Progress Energy sponsor, and the Subsidiary Registrants
participate in, employee savings plans that cover substantially all U.S.
employees. Most employees participate in a matching contribution formula
where Duke Energy provides a matching contribution generally equal to 100%
of employee before-tax and Roth 401(k) contributions, and, as applicable,
after-tax contributions, of up to 6% of eligible pay per pay period. Dividends on
Duke Energy shares held by the savings plans are charged to retained earnings
when declared and shares held in the plans are considered outstanding in the
calculation of basic and diluted earnings per share.
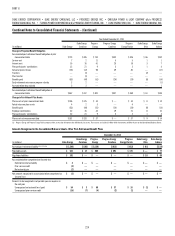
The following table includes pre-tax employer matching contributions
made by Duke Energy and expensed by the Subsidiary Registrants.
(in millions) Duke Energy
Duke Energy
Carolinas
Progress
Energy
Progress Energy
Carolinas
Progress
Energy Florida
Duke Energy
Ohio
Duke Energy
Indiana
For the years ended December 31,
2012 $107 $37 $45 $24 $15 $4 $ 6
2011 86 37 44 23 14 4 8
2010 85 36 43 23 14 4 6