Duke Energy 2012 Annual Report Download - page 4
Download and view the complete annual report
Please find page 4 of the 2012 Duke Energy annual report below. You can navigate through the pages in the report by either clicking on the pages listed below, or by using the keyword search tool below to find specific information within the annual report.-
 1
1 -
 2
2 -
 3
3 -
 4
4 -
 5
5 -
 6
6 -
 7
7 -
 8
8 -
 9
9 -
 10
10 -
 11
11 -
 12
12 -
 13
13 -
 14
14 -
 15
15 -
16
-
17
-
18
-
19
-
20
-
21
-
22
-
23
-
24
-
25
-
26
-
27
-
28
-
29
-
30
-
31
-
32
-
33
-
34
-
35
-
36
-
37
-
38
-
39
-
40
-
41
-
42
-
43
-
44
-
45
-
46
-
47
-
48
-
49
-
50
-
51
-
52
-
53
-
54
-
55
-
56
-
57
-
58
-
59
-
60
-
61
-
62
-
63
-
64
-
65
-
66
-
67
-
68
-
69
-
70
-
71
-
72
-
73
-
74
-
75
-
76
-
77
-
78
-
79
-
80
-
81
-
82
-
83
-
84
-
85
-
86
-
87
-
88
-
89
-
90
-
91
-
92
-
93
-
94
-
95
-
96
-
97
-
98
-
99
-
100
-
101
-
102
-
103
-
104
-
105
-
106
-
107
-
108
-
109
-
110
-
111
-
112
-
113
-
114
-
115
-
116
-
117
-
118
-
119
-
120
-
121
-
122
-
123
-
124
-
125
-
126
-
127
-
128
-
129
-
130
-
131
-
132
-
133
-
134
-
135
-
136
-
137
-
138
-
139
-
140
-
141
-
142
-
143
-
144
-
145
-
146
-
147
-
148
-
149
-
150
-
151
-
152
-
153
-
154
-
155
-
156
-
157
-
158
-
159
-
160
-
161
-
162
-
163
-
164
-
165
-
166
-
167
-
168
-
169
-
170
-
171
-
172
-
173
-
174
-
175
-
176
-
177
-
178
-
179
-
180
-
181
-
182
-
183
-
184
-
185
-
186
-
187
-
188
-
189
-
190
-
191
-
192
-
193
-
194
-
195
-
196
-
197
-
198
-
199
-
200
-
201
-
202
-
203
-
204
-
205
-
206
-
207
-
208
-
209
-
210
-
211
-
212
-
213
-
214
-
215
-
216
-
217
-
218
-
219
-
220
-
221
-
222
-
223
-
224
-
225
-
226
-
227
-
228
-
229
-
230
-
231
-
232
-
233
-
234
-
235
-
236
-
237
-
238
-
239
-
240
-
241
-
242
-
243
-
244
-
245
-
246
-
247
-
248
-
249
-
250
-
251
-
252
-
253
-
254
-
255
-
256
-
257
-
258
-
259
-
260
-
261
-
262
-
263
-
264
-
265
-
266
-
267
-
268
-
269
-
270
-
271
-
272
-
273
-
274
-
275
-
276
-
277
-
278
-
279
-
280
-
281
-
282
-
283
-
284
-
285
-
286
-
287
-
288
-
289
-
290
-
291
-
292
-
293
-
294
-
295
-
296
-
297
-
298
-
299
-
300
-
301
-
302
-
303
-
304
-
305
-
306
-
307
-
308
 |
 |

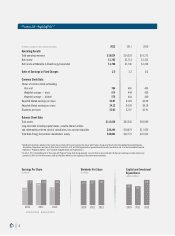
Financial Highlightsa,b
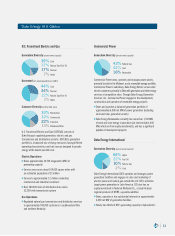
Earnings Per Share
(in dollars)
(In millions, except per-share amounts and ratios) 2012 2011 2010
Operating Results
Total operating revenues $19,624 $14,529 $14,272
Net income $1,782 $1,714 $1,323
Net income attributable to Duke Energy Corporation $1,768 $1,706 $1,320
Ratio of Earnings to Fixed Charges 2.5 3.2 3.0
Common Stock Data
Shares of common stock outstanding
Year-end 704 445 443
Weighted average — basic 574 444 439
Weighted average — diluted 575 444 440
Reported diluted earnings per share $3.07 $3.83 $3.00
Adjusted diluted earnings per share $4.32 $4.38 $4.29
Dividends per share $3.03 $2.97 $2.91
Balance Sheet Data
Total assets $113,856 $62,526 $59,090
Long-term debt including capital leases, variable interest entities
and redeemable preferred stock of subsidiaries, less current maturities $36,244 $18,679 $17,935
Total Duke Energy Corporation shareholders’ equity $40,863 $22,772 $22,522
a
Signicant transactions reected in the results above include: 2012 costs to achieve the merger with Progress Energy (see Note 2 to the Consolidated Financial Statements,
“Acquisitions, Dispositions and Sales of Other Assets”) and 2012, 2011 and 2010 impairments of goodwill and other assets (see Notes 4 and 12 to the Consolidated Financial
Statements, “Regulatory Matters,” and “Goodwill, Intangible Assets and Impairments”).
b
On July 2, 2012, immediately prior to the merger with Progress Energy, Duke Energy executed a one-for-three reverse stock split. All share and earnings per share amounts are
presented as if the one-for-three reverse stock split had been effective at the beginning of the earliest period presented.
2010 2011 2012
Capital and Investment
Expenditures
(dollars in billions)
2010 2011 2012
Dividends Per Share
(in dollars)
2010 2011 2012
Reported Diluted Adjusted Diluted
3.00
3.83
3.07
4.29 4.38 4.32 3.03
2.97
2.91 6.0
4.5
4.9
2