Duke Energy 2012 Annual Report Download - page 27
Download and view the complete annual report
Please find page 27 of the 2012 Duke Energy annual report below. You can navigate through the pages in the report by either clicking on the pages listed below, or by using the keyword search tool below to find specific information within the annual report.-
 1
1 -
2
-
3
-
4
-
5
-
6
-
7
-
8
-
9
-
10
-
11
-
12
-
13
-
14
-
15
-
16
-
 17
17 -
 18
18 -
 19
19 -
 20
20 -
 21
21 -
 22
22 -
 23
23 -
 24
24 -
 25
25 -
 26
26 -
 27
27 -
 28
28 -
 29
29 -
 30
30 -
 31
31 -
 32
32 -
 33
33 -
 34
34 -
 35
35 -
 36
36 -
 37
37 -
38
-
39
-
40
-
41
-
42
-
43
-
44
-
45
-
46
-
47
-
48
-
49
-
50
-
51
-
52
-
53
-
54
-
55
-
56
-
57
-
58
-
59
-
60
-
61
-
62
-
63
-
64
-
65
-
66
-
67
-
68
-
69
-
70
-
71
-
72
-
73
-
74
-
75
-
76
-
77
-
78
-
79
-
80
-
81
-
82
-
83
-
84
-
85
-
86
-
87
-
88
-
89
-
90
-
91
-
92
-
93
-
94
-
95
-
96
-
97
-
98
-
99
-
100
-
101
-
102
-
103
-
104
-
105
-
106
-
107
-
108
-
109
-
110
-
111
-
112
-
113
-
114
-
115
-
116
-
117
-
118
-
119
-
120
-
121
-
122
-
123
-
124
-
125
-
126
-
127
-
128
-
129
-
130
-
131
-
132
-
133
-
134
-
135
-
136
-
137
-
138
-
139
-
140
-
141
-
142
-
143
-
144
-
145
-
146
-
147
-
148
-
149
-
150
-
151
-
152
-
153
-
154
-
155
-
156
-
157
-
158
-
159
-
160
-
161
-
162
-
163
-
164
-
165
-
166
-
167
-
168
-
169
-
170
-
171
-
172
-
173
-
174
-
175
-
176
-
177
-
178
-
179
-
180
-
181
-
182
-
183
-
184
-
185
-
186
-
187
-
188
-
189
-
190
-
191
-
192
-
193
-
194
-
195
-
196
-
197
-
198
-
199
-
200
-
201
-
202
-
203
-
204
-
205
-
206
-
207
-
208
-
209
-
210
-
211
-
212
-
213
-
214
-
215
-
216
-
217
-
218
-
219
-
220
-
221
-
222
-
223
-
224
-
225
-
226
-
227
-
228
-
229
-
230
-
231
-
232
-
233
-
234
-
235
-
236
-
237
-
238
-
239
-
240
-
241
-
242
-
243
-
244
-
245
-
246
-
247
-
248
-
249
-
250
-
251
-
252
-
253
-
254
-
255
-
256
-
257
-
258
-
259
-
260
-
261
-
262
-
263
-
264
-
265
-
266
-
267
-
268
-
269
-
270
-
271
-
272
-
273
-
274
-
275
-
276
-
277
-
278
-
279
-
280
-
281
-
282
-
283
-
284
-
285
-
286
-
287
-
288
-
289
-
290
-
291
-
292
-
293
-
294
-
295
-
296
-
297
-
298
-
299
-
300
-
301
-
302
-
303
-
304
-
305
-
306
-
307
-
308
 |
 |

PART I
7
Energy Capacity and Resources
USFE&G owns over 50,000 megawatts of generation capacity. For
additional information on USFE&G’s generation facilities, see “U.S. Franchised
Electric and Gas” in Item 2.“Properties.”
Energy and capacity are also supplied through contracts with other
generators and purchased on the open market. Factors that could cause
USFE&G to purchase power for its customers include generating plant outages,
extreme weather conditions, generation reliability during the summer, growth,
and price. USFE&G has interconnections and arrangements with its neighboring
utilities to facilitate planning, emergency assistance, sale and purchase of
capacity and energy, and reliability of power supply.
USFE&G’s generation portfolio is a balanced mix of energy resources
having different operating characteristics and fuel sources designed to provide
energy at the lowest possible cost to meet its obligation to serve native-load
customers. All options, including owned generation resources and purchased
power opportunities, are continually evaluated on a real-time basis to select and
dispatch the lowest-cost resources available to meet system load requirements.
The vast majority of Duke Energy Carolinas, Progress Energy Carolinas,
and Duke Energy Indiana’s customer energy needs have historically been met
by large, low-energy-production-cost coal-fi red and nuclear generating units
that operated almost continuously (or at baseload levels). However, recent
commodity pricing trends have resulted in more combined cycle gas-fi red
generation. The vast majority of Progress Energy Florida’s customer energy
needs have historically been met by large, low-energy-production-cost nuclear,
fossil steam and combined cycle gas-fi red generation. However, due to the
extended outage of the Crystal River Nuclear Station Unit 3 (Crystal River Unit 3)
nuclear plant a portion of customer needs have been served with purchased
power for the past 3 years.
CT’s and CC’s are less expensive to build and maintain than either nuclear
or coal, and can be rapidly started or stopped as needed to meet changing
customer loads or operated as base load units depending on commodity prices.
Hydroelectric units produce low-cost energy, but their operations are limited by
the availability of water fl ow.
USFE&G’s pumped-storage hydroelectric facilities in the Carolinas offer
the added fl exibility of using low-cost off-peak energy to pump water that will
be stored for later generation use during times of higher-cost on-peak periods.
These facilities allow USFE&G to maximize the value spreads between different
high- and low-cost generation periods.
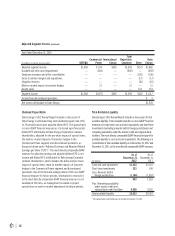
Recently Completed Generation Projects.
During 2012 and 2011, USFE&G completed construction of and placed
into service a total of 3,585 megawatts (MW) of new generation capacity
including Cliffside Unit 6 and the Buck, Dan River, Lee and Smith combined
cycle natural gas facilities. The total capital cost of this new generation capacity
was $4.8 billion.
Generation Projects Currently Under Construction.
The following information relates to generation projects currently under
construction by USFE&G.
Edwardsport Integrated Gasifi cation Combined Cycle (IGCC) Plant.
Duke Energy Indiana has completed the construction and is conducting
testing of a 618 MW Integrated Gasifi cation Combined Cycle (IGCC) power plant
at its existing Edwardsport Generating Station in Knox County, Indiana.
On December 27, 2012, the IURC approved the settlement agreement
fi nalized in April 2012 between Duke Energy Indiana, the Offi ce of Utility
Consumer Counselor (OUCC), the Duke Energy Indiana Industrial Group
and Nucor Steel Indiana, on the cost increase for the construction of the
Edwardsport IGCC plant. The settlement agreement, as approved, caps costs to
be refl ected in customer rates at $2.595 billion, including estimated allowance
for funds used during construction (AFUDC) through June 30, 2012. Duke Energy
Indiana was allowed to recover AFUDC after June 30, 2012 until customer rates
are revised, with such recovery decreasing to 85% on AFUDC accrued after
November 30, 2012.
Duke Energy Indiana’s current cost estimate for the Edwardsport IGCC
plant is approximately $3.154 billion, excluding fi nancing costs. Through
December 31, 2012, Duke Energy Indiana has recorded total pre-tax impairment
and other charges of $897 million related to the Edwardsport IGCC plant. If cost
estimates for the plant increase, additional charges to expense, which could be
material, could occur. The Edwardsport IGCC plant is expected to be in service
by mid-2013. See Note 4 to the Consolidated Financial Statements, “Regulatory
Matters” for further information.
L.V. Sutton Combined Cycle Facility.
Progress Energy Carolinas is in the process of constructing an
approximately 625 MW natural gas-fi red generating facility at its existing
L.V. Sutton Steam Station (Sutton) in New Hanover County, North Carolina. The
Sutton project has an expected in-service date of December 2013. Based on
updated cost estimates, total costs (including AFUDC) for the Sutton project is
estimated to be approximately $600 million.
Potential New Construction.
The following information relates to major generation projects currently
being evaluated for construction by USFE&G.
Shearon Harris Nuclear Station Expansion.
In 2006, Progress Energy Carolinas selected a site at its existing
Shearon Harris Nuclear Station (Harris) to evaluate for possible future nuclear
expansion. On February 19, 2008, Progress Energy Carolinas fi led its combined
Construction and Operating License (COL) application with the Nuclear
Regulatory Commission (NRC) for two Westinghouse Electric Advanced Passive
(AP) 1000 reactors at Harris, which the NRC docketed on April 17, 2008. No
petitions to intervene have been admitted in the Harris COL application.
Levy Nuclear Station.
On July 30, 2008, Progress Energy Florida fi led its COL application with
the NRC for two Westinghouse AP1000 reactors at its proposed Levy Nuclear
Station (Levy), which the NRC docketed on October 6, 2008. Various parties
fi led a joint petition to intervene in the Levy COL application. On October 31,
2012 and November 1, 2012, the Atomic Safety and Licensing Board held
an evidentiary hearing on portions of the intervention petitions. A decision is
expected in March 2013. In 2008, the FPSC granted Progress Energy Florida’s
petition for an affi rmative Determination of Need and related orders requesting
cost recovery under Florida’s nuclear cost-recovery rule for Levy, together with
the associated facilities, including transmission lines and substation facilities.
On April 30, 2012, as part of its annual nuclear cost recovery fi ling,
Progress Energy Florida updated the Levy project schedule and cost. Due to
lower-than-projected customer demand, the lingering economic slowdown,
uncertainty regarding potential carbon regulation and current low natural gas
prices, Progress Energy Florida has shifted the in-service date for the fi rst
Levy unit to 2024, with the second unit following 18 months later. The revised
schedule is consistent with the recovery approach included in the 2012 FPSC
Settlement Agreement. Although the scope and overnight cost for Levy, including
land acquisition, related transmission work and other required investments,
remain essentially unchanged, the shift in schedule will increase escalation and
carrying costs and raise the total estimated project cost to between $19 billion
and $24 billion.
Along with the FPSC’s annual prudence reviews, Progress Energy Florida
will continue to evaluate the project on an ongoing basis based on certain
criteria, including, but not limited to, cost; potential carbon regulation; fossil
fuel prices; the benefi ts of fuel diversifi cation; public, regulatory and political