Duke Energy 2012 Annual Report Download - page 141
Download and view the complete annual report
Please find page 141 of the 2012 Duke Energy annual report below. You can navigate through the pages in the report by either clicking on the pages listed below, or by using the keyword search tool below to find specific information within the annual report.-
 1
1 -
2
-
3
-
4
-
5
-
6
-
7
-
8
-
9
-
10
-
11
-
12
-
13
-
14
-
15
-
16
-
17
-
18
-
19
-
20
-
21
-
22
-
23
-
24
-
25
-
26
-
27
-
28
-
29
-
30
-
31
-
32
-
33
-
34
-
35
-
36
-
37
-
38
-
39
-
40
-
41
-
42
-
43
-
44
-
45
-
46
-
47
-
48
-
49
-
50
-
51
-
52
-
53
-
54
-
55
-
56
-
57
-
58
-
59
-
60
-
61
-
62
-
63
-
64
-
65
-
66
-
67
-
68
-
69
-
70
-
71
-
72
-
73
-
74
-
75
-
76
-
77
-
78
-
79
-
80
-
81
-
82
-
83
-
84
-
85
-
86
-
87
-
88
-
89
-
90
-
91
-
92
-
93
-
94
-
95
-
96
-
97
-
98
-
99
-
100
-
101
-
102
-
103
-
104
-
105
-
106
-
107
-
108
-
109
-
110
-
111
-
112
-
113
-
114
-
115
-
116
-
117
-
118
-
119
-
120
-
121
-
122
-
123
-
124
-
125
-
126
-
127
-
128
-
129
-
130
-
 131
131 -
 132
132 -
 133
133 -
 134
134 -
 135
135 -
 136
136 -
 137
137 -
 138
138 -
 139
139 -
 140
140 -
 141
141 -
 142
142 -
 143
143 -
 144
144 -
 145
145 -
 146
146 -
 147
147 -
 148
148 -
 149
149 -
 150
150 -
 151
151 -
152
-
153
-
154
-
155
-
156
-
157
-
158
-
159
-
160
-
161
-
162
-
163
-
164
-
165
-
166
-
167
-
168
-
169
-
170
-
171
-
172
-
173
-
174
-
175
-
176
-
177
-
178
-
179
-
180
-
181
-
182
-
183
-
184
-
185
-
186
-
187
-
188
-
189
-
190
-
191
-
192
-
193
-
194
-
195
-
196
-
197
-
198
-
199
-
200
-
201
-
202
-
203
-
204
-
205
-
206
-
207
-
208
-
209
-
210
-
211
-
212
-
213
-
214
-
215
-
216
-
217
-
218
-
219
-
220
-
221
-
222
-
223
-
224
-
225
-
226
-
227
-
228
-
229
-
230
-
231
-
232
-
233
-
234
-
235
-
236
-
237
-
238
-
239
-
240
-
241
-
242
-
243
-
244
-
245
-
246
-
247
-
248
-
249
-
250
-
251
-
252
-
253
-
254
-
255
-
256
-
257
-
258
-
259
-
260
-
261
-
262
-
263
-
264
-
265
-
266
-
267
-
268
-
269
-
270
-
271
-
272
-
273
-
274
-
275
-
276
-
277
-
278
-
279
-
280
-
281
-
282
-
283
-
284
-
285
-
286
-
287
-
288
-
289
-
290
-
291
-
292
-
293
-
294
-
295
-
296
-
297
-
298
-
299
-
300
-
301
-
302
-
303
-
304
-
305
-
306
-
307
-
308
 |
 |

121
PART II
Combined Notes to Consolidated Financial Statements – (Continued)
DUKE ENERGY CORPORATION • DUKE ENERGY CAROLINAS, LLC • PROGRESS ENERGY, INC. • CAROLINA POWER & LIGHT COMPANY d/b/a PROGRESS ENERGY
CAROLINAS, INC. • FLORIDA POWER CORPORATION d/b/a PROGRESS ENERY FLORIDA, INC. • DUKE ENERGY OHIO, INC. • DUKE ENERGY INDIANA, INC.
(in millions)
Duke
Energy
Duke
Energy
Carolinas
Progress
Energy
Progress
Energy
Carolinas
Progress
Energy
Florida
Duke
Energy
Ohio
Duke
Energy
Indiana
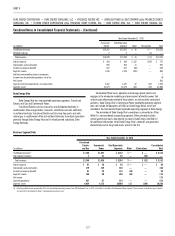
FERC Mitigation $117 $ 46 $ 71 $ 71 $— $— $—
Severance costs 196 63 82 55 27 21 18
Community support, charitable contributions and other 169 79 74 63 11 7 6
Total $482 $188 $227 $ 189 $ 38 $ 28 $ 24
The FERC Mitigation charges refl ect the portion of transmission project
costs that were probable of disallowance, the impairment of the carrying
value of the generation assets serving the Interim FERC Mitigation, and the
mark-to-market loss recognized on the power sale agreements upon closing
of the merger. The charges related to the transmission projects and the
impairment of the carrying value of generation assets were recorded within
Impairment charges in the Consolidated Statements of Operations for the year
ended December 31, 2012. The mark-to-market loss on the interim power
sale agreements was recorded in Regulated electric operating revenues in the
Consolidated Statements of Operations for the year ended December 31, 2012.
Subsequent changes in the fair value of the interim power sale agreements over
the life of the contracts and realized gains or losses on the interim contract
sales are also recorded within Regulated electric operating revenues. The ability
to successfully defend future recovery of a portion of the transmission projects
in rates and any future changes to estimated transmission project costs could
impact the amount that is not expected to be recovered.
In conjunction with the merger, in November 2011, Duke Energy and
Progress Energy each offered a voluntary severance plan (VSP) to certain
eligible employees. VSP and other severance costs incurred during the
year ended December 31, 2012, were recorded primarily within Operation,
maintenance and other in the Consolidated Statements of Operations for the
year ended December 31, 2012. See Note 21 for further information related to
employee severance expenses.
Community support, charitable contributions and other refl ect (i) the
unconditional obligation to provide funding at a level comparable to historic practices
over the next four years, and (ii) fi nancial and legal advisory costs that were incurred
upon the closing of the merger, retention and relocation costs paid to certain
employees. These charges were recorded within Operation, maintenance and other in
the Consolidated Statements of Operations for the year ended December 31, 2012.
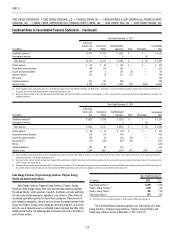
Purchase Price
Pursuant to the merger, all Progress Energy common shares were
exchanged at the fi xed exchange ratio of 0.87083 common shares of Duke
Energy for each Progress Energy common share. The total consideration
transferred in the merger was based on the closing price of Duke Energy
common shares on July 2, 2012, and was calculated as follows:
(dollars in millions, except per share amounts; shares in thousands)
Progress Energy common shares outstanding at July 2, 2012 296,116
Exchange ratio 0.87083
Duke Energy common shares issued for Progress
Energy common shares outstanding
257,867
Closing price of Duke Energy common shares on July 2, 2012 $ 69.84
Purchase price for common stock $ 18,009
Fair value of outstanding earned stock compensation awards 62
Total purchase price $ 18,071
Progress Energy’s stock-based compensation awards, including
performance shares and restricted stock, were replaced with Duke Energy
awards upon consummation of the merger. In accordance with accounting
guidance for business combinations, a portion of the fair value of these awards
is included in the purchase price as it represents consideration transferred in
the merger.
Purchase Price Allocation
The fair value of Progress Energy’s assets acquired and liabilities
assumed was determined based on signifi cant estimates and assumptions,
including level 3 inputs, which are judgmental in nature. The estimates and
assumptions include the projected timing and amount of future cash fl ows;
discount rates refl ecting risk inherent in the future cash fl ows and future market
prices. The fair value of Progress Energy’s assets acquired and liabilities
assumed utilized for the purchase price allocation are preliminary. These
amounts are subject to revision until the valuations are completed, and to the
extent that additional information is obtained about the facts and circumstances
that existed as of the acquisition date, including but not limited to the resolution
of matters pertaining to the retirement of CR3 as well as certain other tax and
contingency related items.
The signifi cant assets and liabilities for which preliminary valuation
amounts are refl ected as of the fi ling of this Form 10-K include the fair value
of the acquired long-term debt, asset retirement obligations, capital leases
and pension and other post-retirement benefi t (OPEB) plans. Additionally
the February 5, 2013 announcement of the decision to retire Progress Energy
Florida’s Crystal River Unit 3, refl ects additional information related to the
facts and circumstances that existed as of the acquisition date. See Note 4 for
additional information related to Crystal River Unit 3. As such, the Progress
Energy assets acquired and liabilities assumed are presented as if the
retirement of Crystal River Unit 3 occurred on the acquisition date. The fair
value of the outstanding stock compensation awards is included in the purchase
price as consideration transferred.
The majority of Progress Energy’s operations are subject to the rate-
setting authority of the FERC, the NCUC, the PSCSC, and the FPSC and are
accounted for pursuant to U.S. GAAP, including the accounting guidance for
regulated operations. The rate-setting and cost recovery provisions currently in
place for Progress Energy’s regulated operations provide revenues derived from
costs, including a return on investment of assets and liabilities included in rate
base. Except for long-term debt, asset retirement obligations, capital leases,
pension and OPEB plans and the wholesale portion of Progress Energy Florida’s
Crystal River Unit 3, the fair values of Progress Energy’s tangible and intangible
assets and liabilities subject to these rate-setting provisions approximate their
carrying values, and the assets and liabilities acquired and pro forma fi nancial
information do not refl ect any net adjustments related to these amounts.
The difference between fair value and the pre-merger carrying amounts for
Progress Energy’s long-term debt, asset retirement obligations, capital leases
and pension and OPEB plans for the regulated operations were recorded as
Regulatory assets.