Duke Energy 2012 Annual Report Download - page 67
Download and view the complete annual report
Please find page 67 of the 2012 Duke Energy annual report below. You can navigate through the pages in the report by either clicking on the pages listed below, or by using the keyword search tool below to find specific information within the annual report.-
 1
1 -
2
-
3
-
4
-
5
-
6
-
7
-
8
-
9
-
10
-
11
-
12
-
13
-
14
-
15
-
16
-
17
-
18
-
19
-
20
-
21
-
22
-
23
-
24
-
25
-
26
-
27
-
28
-
29
-
30
-
31
-
32
-
33
-
34
-
35
-
36
-
37
-
38
-
39
-
40
-
41
-
42
-
43
-
44
-
45
-
46
-
47
-
48
-
49
-
50
-
51
-
52
-
53
-
54
-
55
-
56
-
 57
57 -
 58
58 -
 59
59 -
 60
60 -
 61
61 -
 62
62 -
 63
63 -
 64
64 -
 65
65 -
 66
66 -
 67
67 -
 68
68 -
 69
69 -
 70
70 -
 71
71 -
 72
72 -
 73
73 -
 74
74 -
 75
75 -
 76
76 -
 77
77 -
78
-
79
-
80
-
81
-
82
-
83
-
84
-
85
-
86
-
87
-
88
-
89
-
90
-
91
-
92
-
93
-
94
-
95
-
96
-
97
-
98
-
99
-
100
-
101
-
102
-
103
-
104
-
105
-
106
-
107
-
108
-
109
-
110
-
111
-
112
-
113
-
114
-
115
-
116
-
117
-
118
-
119
-
120
-
121
-
122
-
123
-
124
-
125
-
126
-
127
-
128
-
129
-
130
-
131
-
132
-
133
-
134
-
135
-
136
-
137
-
138
-
139
-
140
-
141
-
142
-
143
-
144
-
145
-
146
-
147
-
148
-
149
-
150
-
151
-
152
-
153
-
154
-
155
-
156
-
157
-
158
-
159
-
160
-
161
-
162
-
163
-
164
-
165
-
166
-
167
-
168
-
169
-
170
-
171
-
172
-
173
-
174
-
175
-
176
-
177
-
178
-
179
-
180
-
181
-
182
-
183
-
184
-
185
-
186
-
187
-
188
-
189
-
190
-
191
-
192
-
193
-
194
-
195
-
196
-
197
-
198
-
199
-
200
-
201
-
202
-
203
-
204
-
205
-
206
-
207
-
208
-
209
-
210
-
211
-
212
-
213
-
214
-
215
-
216
-
217
-
218
-
219
-
220
-
221
-
222
-
223
-
224
-
225
-
226
-
227
-
228
-
229
-
230
-
231
-
232
-
233
-
234
-
235
-
236
-
237
-
238
-
239
-
240
-
241
-
242
-
243
-
244
-
245
-
246
-
247
-
248
-
249
-
250
-
251
-
252
-
253
-
254
-
255
-
256
-
257
-
258
-
259
-
260
-
261
-
262
-
263
-
264
-
265
-
266
-
267
-
268
-
269
-
270
-
271
-
272
-
273
-
274
-
275
-
276
-
277
-
278
-
279
-
280
-
281
-
282
-
283
-
284
-
285
-
286
-
287
-
288
-
289
-
290
-
291
-
292
-
293
-
294
-
295
-
296
-
297
-
298
-
299
-
300
-
301
-
302
-
303
-
304
-
305
-
306
-
307
-
308
 |
 |

47
PART II
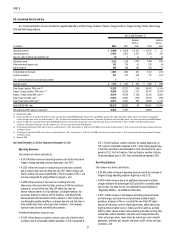
The decrease in Progress Energy Carolinas’ net income for the year ended
December 31, 2012 compared to December 31, 2011 was primarily due to the
following factors:
Operating Revenues.
The variance was primarily due to:
• A $139 million increase in sales to wholesale customers primarily due
to JDA revenues from Duke Energy Carolinas, the impact of an amended
capacity contract with a major wholesale customer that began in May
2012 and a new wholesale contract that began in July 2012,
• A $53 million increase in fuel revenues driven primarily by Interim FERC
Mitigation wholesale fuel revenue and higher fuel rates, and
• A $19 million increase in clause-recoverable regulatory revenues
primarily due to increased spending on new and existing DSM programs.
Partially offsetting these increases was:
• A $67 million decrease in sales to retail customers primarily due to
unfavorable weather conditions. The number of heating degree days
for the 12 months ended December 31, 2012 was 19% below normal
compared to 9% below normal for the same period in 2011. In addition,
cooling degree days for the 12 months ended December 31, 2012 were
3% above normal compared to 19% above normal in the same period
in 2011.
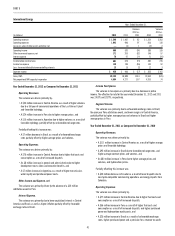
Operating Expenses.
The variance was primarily due to:
• A $303 million increase in Operation and maintenance expenses
primarily due to higher nuclear plant outage costs, higher costs to
achieve the merger with Duke Energy and the prior year non-capital
portion of a favorable judgment from spent fuel litigation, partially
offset by lower storm costs. The higher nuclear plant outage costs are
primarily due to three nuclear refueling outages in 2012 compared to
one outage in 2011,
• A $140 million increase in Fuel used in electric generation and
purchased power primarily due to the impact of higher rates; higher
weather-adjusted volumes and increased purchased power, which
was driven by favorable gas prices and nuclear plant outages; and
generation mix, which was driven by nuclear plant outages, and
• A $51 million increase in Impairment charges primarily due to the
disallowance of transmission project costs, which are a portion of the
FERC Mitigation charges included in the costs to achieve the merger
with Duke Energy.
Interest Expense.
The variance was primarily due to higher interest expense on long-term
debt due to higher average debt outstanding and the prior-year settlement of
2004 and 2005 income tax audits.
Income Tax Expense.
The variance was primarily due to a decrease in pretax net income. The
effective tax rate for the years ended December 31, 2012 and 2011 was 28.7%
and 33.2%, respectively. The decrease in the effective tax rate is primarily due
to the decrease in pretax income.
Matters Impacting Future Progress Energy Carolinas Results
Progress Energy Carolinas fi led a rate case in North Carolina in October
2012, and plans to fi le a rate case in South Carolina before the end of 2013.
These rate cases are needed to recover the cost of plant modernization and
other capital investments in generation, transmission and distribution systems,
as well as increased expenditures for nuclear plants and personnel, vegetation
management and other operating costs. Progress Energy Carolinas’ earnings
could be adversely impacted if these rate cases are denied or delayed by the
NCUC or PSCSC.
The ability to integrate with Duke Energy businesses and realize cost
savings and any other synergies expected from the merger with Duke Energy
could be different from what Progress Energy Carolinas expects and may have
a signifi cant impact on Progress Energy Carolinas’ results of operations.
PROGRESS ENERGY FLORIDA
INTRODUCTION
Management’s Discussion and Analysis should be read in conjunction
with the accompanying Consolidated Financial Statements and Notes for the
years ended December 31, 2012, 2011, and 2010.
BASIS OF PRESENTATION
The results of operations and variance discussion for Progress Energy
Florida is presented in a reduced disclosure format in accordance with General
Instruction (I)(2)(a) of Form 10-K.
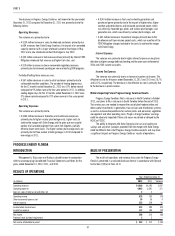
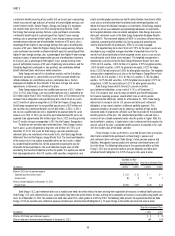
RESULTS OF OPERATIONS
Years Ended December 31,
(in millions) 2012 2011 Variance
Operating revenues $4,689 $4,392 $ 297
Operating expenses 4,062 3,691 371
Gains on sales of other asset and other, net 22—
Operating income 629 703 (74)
Other income and expense, net 39 30 9
Interest expense 255 239 16
Income before income taxes 413 494 (81)
Income tax expense 147 180 (33)
Net income 266 314 (48)
Preferred stock dividend requirement 22—
Net income attributable to parent $ 264 $ 312 $ (48)