Duke Energy 2012 Annual Report Download - page 188
Download and view the complete annual report
Please find page 188 of the 2012 Duke Energy annual report below. You can navigate through the pages in the report by either clicking on the pages listed below, or by using the keyword search tool below to find specific information within the annual report.-
 1
1 -
2
-
3
-
4
-
5
-
6
-
7
-
8
-
9
-
10
-
11
-
12
-
13
-
14
-
15
-
16
-
17
-
18
-
19
-
20
-
21
-
22
-
23
-
24
-
25
-
26
-
27
-
28
-
29
-
30
-
31
-
32
-
33
-
34
-
35
-
36
-
37
-
38
-
39
-
40
-
41
-
42
-
43
-
44
-
45
-
46
-
47
-
48
-
49
-
50
-
51
-
52
-
53
-
54
-
55
-
56
-
57
-
58
-
59
-
60
-
61
-
62
-
63
-
64
-
65
-
66
-
67
-
68
-
69
-
70
-
71
-
72
-
73
-
74
-
75
-
76
-
77
-
78
-
79
-
80
-
81
-
82
-
83
-
84
-
85
-
86
-
87
-
88
-
89
-
90
-
91
-
92
-
93
-
94
-
95
-
96
-
97
-
98
-
99
-
100
-
101
-
102
-
103
-
104
-
105
-
106
-
107
-
108
-
109
-
110
-
111
-
112
-
113
-
114
-
115
-
116
-
117
-
118
-
119
-
120
-
121
-
122
-
123
-
124
-
125
-
126
-
127
-
128
-
129
-
130
-
131
-
132
-
133
-
134
-
135
-
136
-
137
-
138
-
139
-
140
-
141
-
142
-
143
-
144
-
145
-
146
-
147
-
148
-
149
-
150
-
151
-
152
-
153
-
154
-
155
-
156
-
157
-
158
-
159
-
160
-
161
-
162
-
163
-
164
-
165
-
166
-
167
-
168
-
169
-
170
-
171
-
172
-
173
-
174
-
175
-
176
-
177
-
 178
178 -
 179
179 -
 180
180 -
 181
181 -
 182
182 -
 183
183 -
 184
184 -
 185
185 -
 186
186 -
 187
187 -
 188
188 -
 189
189 -
 190
190 -
 191
191 -
 192
192 -
 193
193 -
 194
194 -
 195
195 -
 196
196 -
 197
197 -
 198
198 -
199
-
200
-
201
-
202
-
203
-
204
-
205
-
206
-
207
-
208
-
209
-
210
-
211
-
212
-
213
-
214
-
215
-
216
-
217
-
218
-
219
-
220
-
221
-
222
-
223
-
224
-
225
-
226
-
227
-
228
-
229
-
230
-
231
-
232
-
233
-
234
-
235
-
236
-
237
-
238
-
239
-
240
-
241
-
242
-
243
-
244
-
245
-
246
-
247
-
248
-
249
-
250
-
251
-
252
-
253
-
254
-
255
-
256
-
257
-
258
-
259
-
260
-
261
-
262
-
263
-
264
-
265
-
266
-
267
-
268
-
269
-
270
-
271
-
272
-
273
-
274
-
275
-
276
-
277
-
278
-
279
-
280
-
281
-
282
-
283
-
284
-
285
-
286
-
287
-
288
-
289
-
290
-
291
-
292
-
293
-
294
-
295
-
296
-
297
-
298
-
299
-
300
-
301
-
302
-
303
-
304
-
305
-
306
-
307
-
308
 |
 |

168
PART II
DUKE ENERGY CORPORATION • DUKE ENERGY CAROLINAS, LLC • PROGRESS ENERGY, INC. • CAROLINA POWER & LIGHT COMPANY d/b/a PROGRESS ENERGY
CAROLINAS, INC. • FLORIDA POWER CORPORATION d/b/a PROGRESS ENERY FLORIDA, INC. • DUKE ENERGY OHIO, INC. • DUKE ENERGY INDIANA, INC.
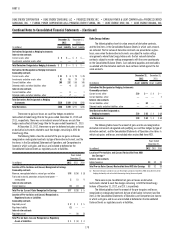
Combined Notes to Consolidated Financial Statements – (Continued)
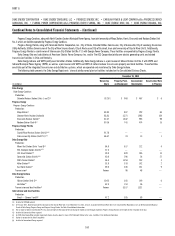
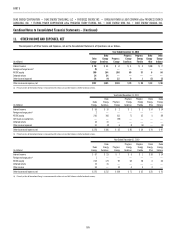
The following table presents amortization expense for gas, coal and power
contracts, wind development rights and other intangible assets.
Years Ended December 31,
(in millions) 2012 2011 2010
Duke Energy $14 $10 $24
Duke Energy Ohio 12 8 20
Duke Energy Indiana 1 1 1
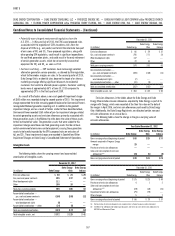
The table below shows the expected amortization expense for the next fi ve
years for intangible assets as of December 31, 2012. The expected amortization
expense includes estimates of emission allowances consumption and estimates
of consumption of commodities such as gas and coal under existing contracts,
as well as estimated amortization related to the wind development projects.
The amortization amounts discussed below are estimates and actual amounts
may differ from these estimates due to such factors as changes in consumption
patterns, sales or impairments of emission allowances or other intangible
assets, delays in the in-service dates of wind assets, additional intangible
acquisitions and other events.
(in millions) 2013 2014 2015 2016 2017
Duke Energy $45 $19 $17 $16 $15
Duke Energy Ohio 8 13 10 10 9
Duke Energy Indiana 30 1 1 1 1
Emission Allowance Impairment.
On August 8, 2011, the EPA’s fi nal rule to replace CAIR was published
in the Federal Register. As further discussed in Note 5, the CSAPR established
state-level annual SO2 and NOx caps that were required to take effect on
January 1, 2012, and state-level ozone-season NOx caps that were to take
effect on May 1, 2012. The CSAPR did not utilize CAA emission allowances as
the original CAIR provided. Under the CSAPR, the EPA was expected to issue
new emission allowances to be used exclusively for purposes of complying with
the CSAPR cap-and-trade program. After this ruling was published in 2011,
Duke Energy evaluated the effect of the CSAPR on the carrying value of emission
allowances recorded at its USFE&G and Commercial Power segments. Based
on the provisions of the CSAPR, Duke Energy Ohio had more SO2 allowances
than were needed to comply with the continuing CAA acid rain cap-and-trade
program (excess emission allowances). Duke Energy Ohio incurred a pre-tax
impairment of $79 million in 2011 to write down the carrying value of excess
emission allowances held by Commercial Power to fair value. The charge
is recorded in Impairment charges on Duke Energy and Duke Energy Ohio’s
Consolidated Statement of Operations. This amount was based on the fair value
of excess allowances held by Commercial Power for compliance under the
continuing CAA acid rain cap-and-trade program as of September 30, 2011.
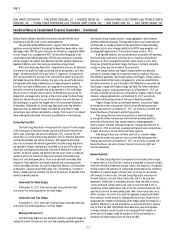
13. INVESTMENTS IN UNCONSOLIDATED AFFILIATES
Investments in domestic and international affi liates that are not controlled
by Duke Energy, but over which it has signifi cant infl uence, are accounted for
using the equity method. Signifi cant investments in affi liates accounted for
under the equity method are discussed below.
Commercial Power
As of December 31, 2012 and 2011 investments accounted for under
the equity method primarily consisted of Duke Energy’s approximate 50%
ownership interest in the fi ve Sweetwater projects (Phase I-V), which own wind
power assets located in Texas. As of December 31, 2012 Duke Energy held a
50% ownership interest in both INDU Solar Holdings, LLC and DS Cornerstone,
LLC, which own solar and wind power projects, respectively. As of December 31,
2011 Duke Energy held a 49% ownership interest in Suez-DEGS Solutions of
Ashtabula LLC, and a 50% ownership interest in INDU Solar Holdings, LLC.
Duke Energy sold its interest in Ashtabula during 2012. The sale did not result in
a signifi cant gain or loss.
International Energy
As of December 31, 2012 and 2011, Duke Energy held a 25% in direct
interest in NMC, which owns and operates a methanol and MTBE business
in Jubail, Saudi Arabia. As of December 31, 2011, Duke Energy held a 25%
ownership interest in Attiki Gas Supply, S.A (Attiki). In the fi rst quarter of 2012,
Duke Energy completed the sale of this interest to an existing equity owner. No
gain or loss was recognized on the sale.
Other
As of December 31, 2012 and 2011, investments accounted for under the
equity method primarily include a 50% ownership interest in DukeNet, which
owns and operates telecommunications businesses.
On December 21, 2010, as discussed in Note 3, Duke Energy completed
an agreement with Alinda to sell a 50% ownership interest in DukeNet. As
a result of the disposition transaction, DukeNet and Alinda are equal 50%
owners in the new joint venture. The sale resulted in a $139 million pre-tax gain
recorded in Gains on Sales of Other Assets and Other, net on the Consolidated
Statements of Operations. Prior to the closing of the transaction, DukeNet was a
consolidated wholly owned subsidiary of Duke Energy.
On December 2, 2010, Duke Energy completed the sale of its 30%
equity investment in Q-Comm to Windstream Corp. (Windstream). The sale
resulted in $165 million in net proceeds, including $87 milli on of Windstream
common shares and a $109 million pre-tax gain recorded in Gains on sales of
unconsolidated affi liates on the Consolidated Statements of Operations.
As of December 31, 2012 and 2011, the carrying amount of investments
in affi liates with carrying amounts greater than zero approximated the amount of
underlying equity in net assets.
Impairments
During the years ended December 31, 2012 and 2010, Duke Energy
recorded pre-tax impairment charges to the carrying value of investments in
unconsolidated affi liates of $6 million a nd $11 million, respectively. There were
no signifi cant pre-tax impairment charges to the carrying value of investments
in unconsolidated affi liates during the year ended December 31, 2011. These
impairment charges, which were recorded in Gains (losses) on sales of
unconsolidated affi liates on the Consolidated Statements of Operations, were
recorded as a result of Duke Energy concluding that it would not be able to
recover its carrying value in the related investments, thus the carrying value of
these investments were written down to their estimated fair value.