Duke Energy 2012 Annual Report Download - page 110
Download and view the complete annual report
Please find page 110 of the 2012 Duke Energy annual report below. You can navigate through the pages in the report by either clicking on the pages listed below, or by using the keyword search tool below to find specific information within the annual report.-
 1
1 -
2
-
3
-
4
-
5
-
6
-
7
-
8
-
9
-
10
-
11
-
12
-
13
-
14
-
15
-
16
-
17
-
18
-
19
-
20
-
21
-
22
-
23
-
24
-
25
-
26
-
27
-
28
-
29
-
30
-
31
-
32
-
33
-
34
-
35
-
36
-
37
-
38
-
39
-
40
-
41
-
42
-
43
-
44
-
45
-
46
-
47
-
48
-
49
-
50
-
51
-
52
-
53
-
54
-
55
-
56
-
57
-
58
-
59
-
60
-
61
-
62
-
63
-
64
-
65
-
66
-
67
-
68
-
69
-
70
-
71
-
72
-
73
-
74
-
75
-
76
-
77
-
78
-
79
-
80
-
81
-
82
-
83
-
84
-
85
-
86
-
87
-
88
-
89
-
90
-
91
-
92
-
93
-
94
-
95
-
96
-
97
-
98
-
99
-
 100
100 -
 101
101 -
 102
102 -
 103
103 -
 104
104 -
 105
105 -
 106
106 -
 107
107 -
 108
108 -
 109
109 -
 110
110 -
 111
111 -
 112
112 -
 113
113 -
 114
114 -
 115
115 -
 116
116 -
 117
117 -
 118
118 -
 119
119 -
 120
120 -
121
-
122
-
123
-
124
-
125
-
126
-
127
-
128
-
129
-
130
-
131
-
132
-
133
-
134
-
135
-
136
-
137
-
138
-
139
-
140
-
141
-
142
-
143
-
144
-
145
-
146
-
147
-
148
-
149
-
150
-
151
-
152
-
153
-
154
-
155
-
156
-
157
-
158
-
159
-
160
-
161
-
162
-
163
-
164
-
165
-
166
-
167
-
168
-
169
-
170
-
171
-
172
-
173
-
174
-
175
-
176
-
177
-
178
-
179
-
180
-
181
-
182
-
183
-
184
-
185
-
186
-
187
-
188
-
189
-
190
-
191
-
192
-
193
-
194
-
195
-
196
-
197
-
198
-
199
-
200
-
201
-
202
-
203
-
204
-
205
-
206
-
207
-
208
-
209
-
210
-
211
-
212
-
213
-
214
-
215
-
216
-
217
-
218
-
219
-
220
-
221
-
222
-
223
-
224
-
225
-
226
-
227
-
228
-
229
-
230
-
231
-
232
-
233
-
234
-
235
-
236
-
237
-
238
-
239
-
240
-
241
-
242
-
243
-
244
-
245
-
246
-
247
-
248
-
249
-
250
-
251
-
252
-
253
-
254
-
255
-
256
-
257
-
258
-
259
-
260
-
261
-
262
-
263
-
264
-
265
-
266
-
267
-
268
-
269
-
270
-
271
-
272
-
273
-
274
-
275
-
276
-
277
-
278
-
279
-
280
-
281
-
282
-
283
-
284
-
285
-
286
-
287
-
288
-
289
-
290
-
291
-
292
-
293
-
294
-
295
-
296
-
297
-
298
-
299
-
300
-
301
-
302
-
303
-
304
-
305
-
306
-
307
-
308
 |
 |

90
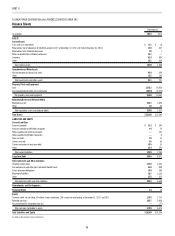
PART II
Years Ended December 31,
(in millions) 2012 2011 2010
Operating Revenues $4,706 $4,547 $4,933
Operating Expenses
Fuel used in electric generation and purchased power 1,895 1,755 2,008
Operation, maintenance and other 1,494 1,191 1,158
Depreciation and amortization 535 514 478
Property and other taxes 219 211 218
Impairment charges 54 3 5
Total operating expenses 4,197 3,674 3,867
Gains on Sales of Other Assets and Other, net 1 3 1
Operating Income 510 876 1,067
Other Income and Expenses, net 79 80 71
Interest Expense 207 184 186
Income Before Income Taxes 382 772 952
Income Tax Expense 110 256 350
Net Income 272 516 602
Less: Net Income (Loss) Attributable to Noncontrolling Interests — — (1)
Net Income Attributable to Controlling Interests 272 516 603
Less: Preferred Stock Dividend Requirement 3 3 3
Net Income Available to Parent $ 269 $ 513 $ 600
Net Income $ 272 $ 516 $ 602
Other Comprehensive (Loss) Income, net of tax
Net unrealized loss on cash fl ow hedges(a) (4) (43) (10)
Reclassifi cation into earnings from cash fl ow hedges(b) 4 5 4
Reclassifi cation of cash fl ow hedges to regulatory assets(c) 71 — —
Other Comprehensive Income (Loss), net of tax 71 (38) (6)
Comprehensive Income 343 478 596
Less: Comprehensive Income (Loss) Attributable to Noncontrolling Interests — — (1)
Comprehensive Income Attributable to Controlling Interests $ 343 $ 478 $ 597
(a) Net of $3 million tax benefi t in 2012, $28 million tax benefi t in 2011 and $6 million tax benefi t in 2010.
(b) Net of $2 million tax expense in 2012, $3 million tax expense in 2011 and $3 million tax expense in 2010.
(c) Net of $46 million tax expense in 2012.
See Notes to Consolidated Financial Statements
CAROLINA POWER & LIGHT COMPANY d/b/a PROGRESS ENERGY CAROLINAS, INC.
Consolidated Statements of Operations and Comprehensive Income