Duke Energy 2012 Annual Report Download - page 171
Download and view the complete annual report
Please find page 171 of the 2012 Duke Energy annual report below. You can navigate through the pages in the report by either clicking on the pages listed below, or by using the keyword search tool below to find specific information within the annual report.-
 1
1 -
2
-
3
-
4
-
5
-
6
-
7
-
8
-
9
-
10
-
11
-
12
-
13
-
14
-
15
-
16
-
17
-
18
-
19
-
20
-
21
-
22
-
23
-
24
-
25
-
26
-
27
-
28
-
29
-
30
-
31
-
32
-
33
-
34
-
35
-
36
-
37
-
38
-
39
-
40
-
41
-
42
-
43
-
44
-
45
-
46
-
47
-
48
-
49
-
50
-
51
-
52
-
53
-
54
-
55
-
56
-
57
-
58
-
59
-
60
-
61
-
62
-
63
-
64
-
65
-
66
-
67
-
68
-
69
-
70
-
71
-
72
-
73
-
74
-
75
-
76
-
77
-
78
-
79
-
80
-
81
-
82
-
83
-
84
-
85
-
86
-
87
-
88
-
89
-
90
-
91
-
92
-
93
-
94
-
95
-
96
-
97
-
98
-
99
-
100
-
101
-
102
-
103
-
104
-
105
-
106
-
107
-
108
-
109
-
110
-
111
-
112
-
113
-
114
-
115
-
116
-
117
-
118
-
119
-
120
-
121
-
122
-
123
-
124
-
125
-
126
-
127
-
128
-
129
-
130
-
131
-
132
-
133
-
134
-
135
-
136
-
137
-
138
-
139
-
140
-
141
-
142
-
143
-
144
-
145
-
146
-
147
-
148
-
149
-
150
-
151
-
152
-
153
-
154
-
155
-
156
-
157
-
158
-
159
-
160
-
 161
161 -
 162
162 -
 163
163 -
 164
164 -
 165
165 -
 166
166 -
 167
167 -
 168
168 -
 169
169 -
 170
170 -
 171
171 -
 172
172 -
 173
173 -
 174
174 -
 175
175 -
 176
176 -
 177
177 -
 178
178 -
 179
179 -
 180
180 -
 181
181 -
182
-
183
-
184
-
185
-
186
-
187
-
188
-
189
-
190
-
191
-
192
-
193
-
194
-
195
-
196
-
197
-
198
-
199
-
200
-
201
-
202
-
203
-
204
-
205
-
206
-
207
-
208
-
209
-
210
-
211
-
212
-
213
-
214
-
215
-
216
-
217
-
218
-
219
-
220
-
221
-
222
-
223
-
224
-
225
-
226
-
227
-
228
-
229
-
230
-
231
-
232
-
233
-
234
-
235
-
236
-
237
-
238
-
239
-
240
-
241
-
242
-
243
-
244
-
245
-
246
-
247
-
248
-
249
-
250
-
251
-
252
-
253
-
254
-
255
-
256
-
257
-
258
-
259
-
260
-
261
-
262
-
263
-
264
-
265
-
266
-
267
-
268
-
269
-
270
-
271
-
272
-
273
-
274
-
275
-
276
-
277
-
278
-
279
-
280
-
281
-
282
-
283
-
284
-
285
-
286
-
287
-
288
-
289
-
290
-
291
-
292
-
293
-
294
-
295
-
296
-
297
-
298
-
299
-
300
-
301
-
302
-
303
-
304
-
305
-
306
-
307
-
308
 |
 |

151
PART II
Combined Notes to Consolidated Financial Statements – (Continued)
DUKE ENERGY CORPORATION • DUKE ENERGY CAROLINAS, LLC • PROGRESS ENERGY, INC. • CAROLINA POWER & LIGHT COMPANY d/b/a PROGRESS ENERGY
CAROLINAS, INC. • FLORIDA POWER CORPORATION d/b/a PROGRESS ENERY FLORIDA, INC. • DUKE ENERGY OHIO, INC. • DUKE ENERGY INDIANA, INC.
Operating and Capital Lease Commitments
The Duke Energy Registrants lease assets in several areas of their
operations. The Duke Energy Registrants lease offi ce buildings, railcars, vehicles,
computer equipment and other property and equipment with various terms and
expiration dates. Additionally, Progress Energy Carolinas has a capital lease related
to fi rm gas pipeline transportation capacity and as discussed under “Purchased
Power,” Progress Energy Carolinas and Progress Energy Florida have entered into
certain purchased power agreements, which are classifi ed as leases. Consolidated
capitalized lease obligations are classifi ed as Long-term debt on the Consolidated
Balance Sheets. Amortization of assets recorded under capital leases is included in
Depreciation and amortization on the Consolidated Statements of Operations.
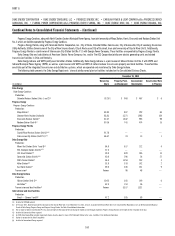
The following table presents rental expense for operating leases. These
amounts are included in Operation, maintenance and other on the Consolidated
Statements of Operations.
For the Years Ended December 31,
(in millions) 2012 2011 2010
Duke Energy $232 $104 $122
Duke Energy Carolinas 38 43 60
Progress Energy 232 104 100
Progress Energy Carolinas 164 88 63
Progress Energy Florida 68 15 37
Duke Energy Ohio 14 19 19
Duke Energy Indiana 20 24 24
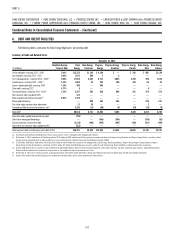
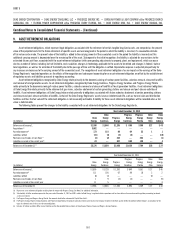
The following table presents future minimum lease payments under
operating leases, which at inception had a non-cancelable term of more than
one year, as of December 31, 2012.
(in millions)
Duke
Energy
Duke
Energy
Carolinas
Progress
Energy
Progress
Energy
Carolinas
Progress
Energy
Florida
Duke
Energy
Ohio
Duke
Energy
Indiana
2013 $ 171 $ 35 $ 91 $ 47 $ 38 $11 $19
2014 156 28 88 46 37 10 15
2015 139 21 86 46 37 8 12
2016 127 16 85 46 36 7 9
2017 108 14 71 35 36 6 6
Thereafter 981 77 721 431 290 24 7
Total $1,682 $191 $1,142 $651 $474 $66 $68
The following table presents future minimum lease payments under
capital leases as of December 31, 2012.
(in millions)
Duke
Energy
Duke
Energy
Carolinas
Progress
Energy
Progress
Energy
Carolinas
Progress
Energy
Florida
Duke
Energy
Ohio
Duke
Energy
Indiana
2013 $ 210 $ 7 $ 47 $ 21 $ 26 $10 $ 5
2014 180 7 46 20 26 9 5
2015 181 7 46 20 26 7 4
2016 183 8 45 19 26 6 4
2017 180 8 45 20 25 3 1
Thereafter 1,779 65 579 325 254 5 35
Minimum annual
payments 2,713 102 808 425 383 40 54
Less amount
representing
interest (1,024) (70) (469) (275) (194) (5) (31)
Total $ 1,689 $ 32 $ 339 $ 150 $ 189 $35 $ 23