Duke Energy 2012 Annual Report Download - page 47
Download and view the complete annual report
Please find page 47 of the 2012 Duke Energy annual report below. You can navigate through the pages in the report by either clicking on the pages listed below, or by using the keyword search tool below to find specific information within the annual report.-
 1
1 -
2
-
3
-
4
-
5
-
6
-
7
-
8
-
9
-
10
-
11
-
12
-
13
-
14
-
15
-
16
-
17
-
18
-
19
-
20
-
21
-
22
-
23
-
24
-
25
-
26
-
27
-
28
-
29
-
30
-
31
-
32
-
33
-
34
-
35
-
36
-
 37
37 -
 38
38 -
 39
39 -
 40
40 -
 41
41 -
 42
42 -
 43
43 -
 44
44 -
 45
45 -
 46
46 -
 47
47 -
 48
48 -
 49
49 -
 50
50 -
 51
51 -
 52
52 -
 53
53 -
 54
54 -
 55
55 -
 56
56 -
 57
57 -
58
-
59
-
60
-
61
-
62
-
63
-
64
-
65
-
66
-
67
-
68
-
69
-
70
-
71
-
72
-
73
-
74
-
75
-
76
-
77
-
78
-
79
-
80
-
81
-
82
-
83
-
84
-
85
-
86
-
87
-
88
-
89
-
90
-
91
-
92
-
93
-
94
-
95
-
96
-
97
-
98
-
99
-
100
-
101
-
102
-
103
-
104
-
105
-
106
-
107
-
108
-
109
-
110
-
111
-
112
-
113
-
114
-
115
-
116
-
117
-
118
-
119
-
120
-
121
-
122
-
123
-
124
-
125
-
126
-
127
-
128
-
129
-
130
-
131
-
132
-
133
-
134
-
135
-
136
-
137
-
138
-
139
-
140
-
141
-
142
-
143
-
144
-
145
-
146
-
147
-
148
-
149
-
150
-
151
-
152
-
153
-
154
-
155
-
156
-
157
-
158
-
159
-
160
-
161
-
162
-
163
-
164
-
165
-
166
-
167
-
168
-
169
-
170
-
171
-
172
-
173
-
174
-
175
-
176
-
177
-
178
-
179
-
180
-
181
-
182
-
183
-
184
-
185
-
186
-
187
-
188
-
189
-
190
-
191
-
192
-
193
-
194
-
195
-
196
-
197
-
198
-
199
-
200
-
201
-
202
-
203
-
204
-
205
-
206
-
207
-
208
-
209
-
210
-
211
-
212
-
213
-
214
-
215
-
216
-
217
-
218
-
219
-
220
-
221
-
222
-
223
-
224
-
225
-
226
-
227
-
228
-
229
-
230
-
231
-
232
-
233
-
234
-
235
-
236
-
237
-
238
-
239
-
240
-
241
-
242
-
243
-
244
-
245
-
246
-
247
-
248
-
249
-
250
-
251
-
252
-
253
-
254
-
255
-
256
-
257
-
258
-
259
-
260
-
261
-
262
-
263
-
264
-
265
-
266
-
267
-
268
-
269
-
270
-
271
-
272
-
273
-
274
-
275
-
276
-
277
-
278
-
279
-
280
-
281
-
282
-
283
-
284
-
285
-
286
-
287
-
288
-
289
-
290
-
291
-
292
-
293
-
294
-
295
-
296
-
297
-
298
-
299
-
300
-
301
-
302
-
303
-
304
-
305
-
306
-
307
-
308
 |
 |

PART I
27
(h) Includes Wabash River IC.
(i) This generation facility is jointly owned by Duke Energy Indiana and the Wabash Valley Power Association.
(j) Duke Energy has announced plans to retire these plants in 2013.
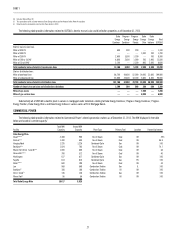
The following table provides information related to USFE&G’s electric transmission and distribution properties as of December 31, 2012.
Duke
Energy
Carolinas
Progress
Energy
Carolinas
Progress
Energy
Florida
Duke
Energy
Ohio
Duke
Energy
Indiana
Total
USFE&G
Electric transmission lines:
Miles of 525 KV 600 300 200 — — 1,100
Miles of 345 KV — — — 1,000 700 1,700
Miles of 230 KV 2,600 3,300 1,700 — 700 8,300
Miles of 100 to 161 KV 6,800 2,600 1,000 700 1,400 12,500
Miles of 13 to 69 KV 3,100 — 2,200 800 2,500 8,600
Total conductor miles of electric transmission lines 13,100 6,200 5,100 2,500 5,300 32,200
Electric distribution lines:
Miles of overhead lines 66,700 44,600 52,000 14,000 22,600 199,900
Miles of underground line 35,000 22,400 18,700 5,600 8,300 90,000
Total conductor miles of electric distribution lines 101,700 67,000 70,700 19,600 30,900 289,900
Number of electric transmission and distribution substations 1,500 500 500 300 500 3,300
Miles of gas mains — — — 7,200 — 7,200
Miles of gas service lines — — — 6,000 — 6,000
Substantially all of USFE&G’s electric plant in service is mortgaged under indentures relating to Duke Energy Carolinas’, Progress Energy Carolinas’, Progress
Energy Florida’s, Duke Energy Ohio’s and Duke Energy Indiana’s various series of First Mortgage Bonds.
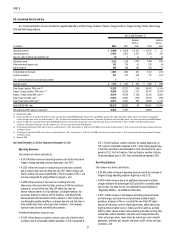
COMMERCIAL POWER
The following table provides information related to Commercial Power’s electric generation stations as of December 31, 2012. The MW displayed in the table
below are based on summer capacity.”
Facility
Total MW
Capacity
Owned MW
Capacity Plant Type Primary Fuel Location Ownership Interest
Duke Energy Ohio:
Stuart(a)(b)(c) 2,308 900 Fossil Steam Coal OH 39 %
Zimmer(a)(c) 1,300 605 Fossil Steam Coal OH 46.5
Hanging Rock 1,226 1,226 Combined Cycle Gas OH 100
Beckjord(a)(c) 1,024 765 Fossil Steam Coal OH 74.7
Miami Fort (Units 7 and 8)(a)(c) 1,000 640 Fossil Steam Coal OH 64
Conesville(a)(b)(c) 780 312 Fossil Steam Coal OH 40
Washington 617 617 Combined Cycle Gas OH 100
Fayette 614 614 Combined Cycle Gas PA 100
Killen(a)(b)(c) 600 198 Fossil Steam Coal OH 33
Lee 568 568 Combustion Turbine Gas IL 100
Beckjord(c) 188 188 Combustion Turbine Oil OH 100
Dick’s Creek(c) 136 136 Combustion Turbine Gas OH 100
Miami Fort(c) 56 56 Combustion Turbine Oil OH 100
Total Duke Energy Ohio 10,417 6,825