Duke Energy 2012 Annual Report Download - page 103
Download and view the complete annual report
Please find page 103 of the 2012 Duke Energy annual report below. You can navigate through the pages in the report by either clicking on the pages listed below, or by using the keyword search tool below to find specific information within the annual report.-
 1
1 -
2
-
3
-
4
-
5
-
6
-
7
-
8
-
9
-
10
-
11
-
12
-
13
-
14
-
15
-
16
-
17
-
18
-
19
-
20
-
21
-
22
-
23
-
24
-
25
-
26
-
27
-
28
-
29
-
30
-
31
-
32
-
33
-
34
-
35
-
36
-
37
-
38
-
39
-
40
-
41
-
42
-
43
-
44
-
45
-
46
-
47
-
48
-
49
-
50
-
51
-
52
-
53
-
54
-
55
-
56
-
57
-
58
-
59
-
60
-
61
-
62
-
63
-
64
-
65
-
66
-
67
-
68
-
69
-
70
-
71
-
72
-
73
-
74
-
75
-
76
-
77
-
78
-
79
-
80
-
81
-
82
-
83
-
84
-
85
-
86
-
87
-
88
-
89
-
90
-
91
-
92
-
 93
93 -
 94
94 -
 95
95 -
 96
96 -
 97
97 -
 98
98 -
 99
99 -
 100
100 -
 101
101 -
 102
102 -
 103
103 -
 104
104 -
 105
105 -
 106
106 -
 107
107 -
 108
108 -
 109
109 -
 110
110 -
 111
111 -
 112
112 -
 113
113 -
114
-
115
-
116
-
117
-
118
-
119
-
120
-
121
-
122
-
123
-
124
-
125
-
126
-
127
-
128
-
129
-
130
-
131
-
132
-
133
-
134
-
135
-
136
-
137
-
138
-
139
-
140
-
141
-
142
-
143
-
144
-
145
-
146
-
147
-
148
-
149
-
150
-
151
-
152
-
153
-
154
-
155
-
156
-
157
-
158
-
159
-
160
-
161
-
162
-
163
-
164
-
165
-
166
-
167
-
168
-
169
-
170
-
171
-
172
-
173
-
174
-
175
-
176
-
177
-
178
-
179
-
180
-
181
-
182
-
183
-
184
-
185
-
186
-
187
-
188
-
189
-
190
-
191
-
192
-
193
-
194
-
195
-
196
-
197
-
198
-
199
-
200
-
201
-
202
-
203
-
204
-
205
-
206
-
207
-
208
-
209
-
210
-
211
-
212
-
213
-
214
-
215
-
216
-
217
-
218
-
219
-
220
-
221
-
222
-
223
-
224
-
225
-
226
-
227
-
228
-
229
-
230
-
231
-
232
-
233
-
234
-
235
-
236
-
237
-
238
-
239
-
240
-
241
-
242
-
243
-
244
-
245
-
246
-
247
-
248
-
249
-
250
-
251
-
252
-
253
-
254
-
255
-
256
-
257
-
258
-
259
-
260
-
261
-
262
-
263
-
264
-
265
-
266
-
267
-
268
-
269
-
270
-
271
-
272
-
273
-
274
-
275
-
276
-
277
-
278
-
279
-
280
-
281
-
282
-
283
-
284
-
285
-
286
-
287
-
288
-
289
-
290
-
291
-
292
-
293
-
294
-
295
-
296
-
297
-
298
-
299
-
300
-
301
-
302
-
303
-
304
-
305
-
306
-
307
-
308
 |
 |

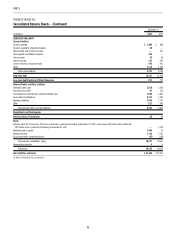
83
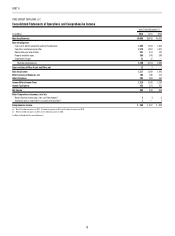
PART II
Years Ended December 31,
(in millions) 2012 2011 2010
Operating Revenues $9,405 $8,948 $10,223
Operating Expenses
Fuel used in electric generation and purchased power 4,304 4,043 4,621
Operation, maintenance and other 2,445 2,060 2,045
Depreciation and amortization 747 701 920
Property and other taxes 570 562 580
Impairment charges 200 3 5
Total operating expenses 8,266 7,369 8,171
(Losses) Gains on Sales of Other Assets and Other, net (2) 4 (8)
Operating Income 1,137 1,583 2,044
Other Income and Expenses, net 130 52 109
Interest Expense 740 725 747
Income From Continuing Operations Before Income Taxes 527 910 1,406
Income Tax Expense From Continuing Operations 172 323 539
Income From Continuing Operations 355 587 867
Income (Loss) From Discontinued Operations, net of tax 52 (5) (4)
Net Income 407 582 863
Less: Net Income Attributable to Noncontrolling Interests 7 7 7
Net Income Attributable to Parent $ 400 $ 575 $ 856
Net Income $ 407 $ 582 $ 863
Other Comprehensive (Loss) Income, net of tax
Pension and OPEB adjustments(a) (4) 34 (13)
Reclassifi cation into earnings from pension and OPEB adjustments(b) 2 5 3
Net unrealized loss on cash fl ow hedges(c) (5) (87) (34)
Reclassifi cation into earnings from cash fl ow hedges(d) 8 8 6
Reclassifi cation of cash fl ow hedges to regulatory assets(e) 97 — —
Other Comprehensive Income (Loss), net of tax 98 (40) (38)
Comprehensive Income 505 542 825
Less: Comprehensive Income Attributable to Noncontrolling Interests 7 7 7
Comprehensive Income Attributable to Parent $ 498 $ 535 $ 818
(a) Net of $1 million tax benefi t in 2012, $24 million tax expense in 2011 and $8 million tax benefi t in 2010.
(b) Net of $1 million tax expense in 2012, $3 million tax expense in 2011 and $2 million tax expense in 2010.
(c) Net of $3 million tax benefi t in 2012, $56 million tax benefi t in 2011 and $22 million tax benefi t in 2010.
(d) Net of $6 million tax expense in 2012, $5 million tax expense in 2011 and $4 million tax expense in 2010.
(e) Net of $62 million tax expense in 2012.
See Notes to Consolidated Financial Statements
PROGRESS ENERGY, INC.
Consolidated Statements of Operations and Comprehensive Income