Duke Energy 2012 Annual Report Download - page 56
Download and view the complete annual report
Please find page 56 of the 2012 Duke Energy annual report below. You can navigate through the pages in the report by either clicking on the pages listed below, or by using the keyword search tool below to find specific information within the annual report.-
 1
1 -
2
-
3
-
4
-
5
-
6
-
7
-
8
-
9
-
10
-
11
-
12
-
13
-
14
-
15
-
16
-
17
-
18
-
19
-
20
-
21
-
22
-
23
-
24
-
25
-
26
-
27
-
28
-
29
-
30
-
31
-
32
-
33
-
34
-
35
-
36
-
37
-
38
-
39
-
40
-
41
-
42
-
43
-
44
-
45
-
 46
46 -
 47
47 -
 48
48 -
 49
49 -
 50
50 -
 51
51 -
 52
52 -
 53
53 -
 54
54 -
 55
55 -
 56
56 -
 57
57 -
 58
58 -
 59
59 -
 60
60 -
 61
61 -
 62
62 -
 63
63 -
 64
64 -
 65
65 -
 66
66 -
67
-
68
-
69
-
70
-
71
-
72
-
73
-
74
-
75
-
76
-
77
-
78
-
79
-
80
-
81
-
82
-
83
-
84
-
85
-
86
-
87
-
88
-
89
-
90
-
91
-
92
-
93
-
94
-
95
-
96
-
97
-
98
-
99
-
100
-
101
-
102
-
103
-
104
-
105
-
106
-
107
-
108
-
109
-
110
-
111
-
112
-
113
-
114
-
115
-
116
-
117
-
118
-
119
-
120
-
121
-
122
-
123
-
124
-
125
-
126
-
127
-
128
-
129
-
130
-
131
-
132
-
133
-
134
-
135
-
136
-
137
-
138
-
139
-
140
-
141
-
142
-
143
-
144
-
145
-
146
-
147
-
148
-
149
-
150
-
151
-
152
-
153
-
154
-
155
-
156
-
157
-
158
-
159
-
160
-
161
-
162
-
163
-
164
-
165
-
166
-
167
-
168
-
169
-
170
-
171
-
172
-
173
-
174
-
175
-
176
-
177
-
178
-
179
-
180
-
181
-
182
-
183
-
184
-
185
-
186
-
187
-
188
-
189
-
190
-
191
-
192
-
193
-
194
-
195
-
196
-
197
-
198
-
199
-
200
-
201
-
202
-
203
-
204
-
205
-
206
-
207
-
208
-
209
-
210
-
211
-
212
-
213
-
214
-
215
-
216
-
217
-
218
-
219
-
220
-
221
-
222
-
223
-
224
-
225
-
226
-
227
-
228
-
229
-
230
-
231
-
232
-
233
-
234
-
235
-
236
-
237
-
238
-
239
-
240
-
241
-
242
-
243
-
244
-
245
-
246
-
247
-
248
-
249
-
250
-
251
-
252
-
253
-
254
-
255
-
256
-
257
-
258
-
259
-
260
-
261
-
262
-
263
-
264
-
265
-
266
-
267
-
268
-
269
-
270
-
271
-
272
-
273
-
274
-
275
-
276
-
277
-
278
-
279
-
280
-
281
-
282
-
283
-
284
-
285
-
286
-
287
-
288
-
289
-
290
-
291
-
292
-
293
-
294
-
295
-
296
-
297
-
298
-
299
-
300
-
301
-
302
-
303
-
304
-
305
-
306
-
307
-
308
 |
 |

36
PART II
with management’s use of the new reporting measure, certain governance
costs that were previously unallocated have now been allocated to each of the
segments. In addition, direct interest expense and income taxes are included
in segment income. Prior year fi nancial information has been recast to conform
to the current year presentation. None of these changes impacts the reportable
operating segments or the Duke Energy Registrants’ previously reported
consolidated revenues, net income or EPS.
Management also uses adjusted segment income as a measure of
historical and anticipated future segment and Other performance. Adjusted
segment income is a Non-GAAP fi nancial measure, as it is based upon
segment income adjusted for special items and the mark-to-market impact
of economic hedges in the Commercial Power segment. Management believes
that the presentation of adjusted segment income provides useful information
to investors, as it provides them with an additional relevant comparison of a
segment’s performance across periods.
The most directly comparable GAAP measure for adjusted segment
income is reported segment income, which represents segment income from
continuing operations, including any special items and the mark-to-market
impact of economic hedges in the Commercial Power segment.
See Note 3 to the Consolidated Financial Statements, “Business
Segments,” for a discussion of Duke Energy’s segment structure.
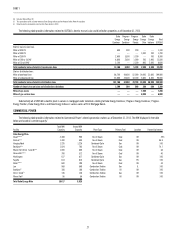
Duke Energy’s segment income and adjusted segment income may not
be comparable to similarly titled measures of another company because other
entities may not calculate segment income or adjusted segment income in
the same manner. The following tables reconcile adjusted segment income to
segment income, and detailed discussions follow.
Year Ended December 31, 2012
(in millions, except per share amounts) USFE&G
Commercial
Power
International
Energy
Total
Reportable
Segments Other
Duke
Energy
Adjusted segment income $2,086 $ 93 $439 $2,618 $(135) $2,483
Edwardsport impairment and other charges (402) — — (402) — (402)
Costs to achieve mergers and acquisitions — — — — (397) (397)
Mark-to-market impact of economic hedges — (6) — (6) — (6)
Democratic National Convention Host Committee support —— ——(6)(6)
Employee severance and offi ce consolidation 60 — — 60 — 60
Segment income $1,744 $ 87 $439 $2,270 $(538) $1,732
Income from discontinued operations $36
Net income attributable to Duke Energy $1,768
Year Ended December 31, 2011
(in millions, except per share amounts) USFE&G
Commercial
Power
International
Energy
Total
Reportable
Segments Other
Duke
Energy
Adjusted segment income $1,316 $ 186 $ 466 $ 1,968 $ (25) $1,943
Edwardsport impairment and other charges (135) — — (135) — (135)
Emission allowance impairment — (51) — (51) — (51)
Costs to achieve mergers and acquisitions — — — — (51) (51)
Mark-to-market impact of economic hedges — (1) — (1) — (1)
Segment income $1,181 $ 134 $ 466 $ 1,781 $ (76) $1,705
Income from discontinued operations $1
Net income attributable to Duke Energy $1,706
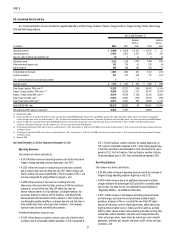
Year Ended December 31, 2010
(in millions, except per share amounts) USFE&G
Commercial
Power
International
Energy
Total
Reportable
Segments Other
Duke
Energy
Adjusted segment income $1,380 $ 254 $ 305 $ 1,939 $ (57) $1,882
Goodwill and other asset impairments — (602) — (602) — (602)
Employee severance and offi ce consolidation — — — — (105) (105)
Costs to achieve mergers and acquisitions — — — — (17) (17)
Litigation reserves — — — — (16) (16)
Mark-to-market impact of economic hedges — 21 — 21 — 21
Assets sales — — — — 154 154
Segment income $1,380 $ (327) $ 305 $ 1,358 $ (41) $1,317
Income from discontinued operations $3
Net income attributable to Duke Energy $1,320
The remaining information presented through this discussion of results of operations is presented on a GAAP basis.