Duke Energy 2012 Annual Report Download - page 197
Download and view the complete annual report
Please find page 197 of the 2012 Duke Energy annual report below. You can navigate through the pages in the report by either clicking on the pages listed below, or by using the keyword search tool below to find specific information within the annual report.-
 1
1 -
2
-
3
-
4
-
5
-
6
-
7
-
8
-
9
-
10
-
11
-
12
-
13
-
14
-
15
-
16
-
17
-
18
-
19
-
20
-
21
-
22
-
23
-
24
-
25
-
26
-
27
-
28
-
29
-
30
-
31
-
32
-
33
-
34
-
35
-
36
-
37
-
38
-
39
-
40
-
41
-
42
-
43
-
44
-
45
-
46
-
47
-
48
-
49
-
50
-
51
-
52
-
53
-
54
-
55
-
56
-
57
-
58
-
59
-
60
-
61
-
62
-
63
-
64
-
65
-
66
-
67
-
68
-
69
-
70
-
71
-
72
-
73
-
74
-
75
-
76
-
77
-
78
-
79
-
80
-
81
-
82
-
83
-
84
-
85
-
86
-
87
-
88
-
89
-
90
-
91
-
92
-
93
-
94
-
95
-
96
-
97
-
98
-
99
-
100
-
101
-
102
-
103
-
104
-
105
-
106
-
107
-
108
-
109
-
110
-
111
-
112
-
113
-
114
-
115
-
116
-
117
-
118
-
119
-
120
-
121
-
122
-
123
-
124
-
125
-
126
-
127
-
128
-
129
-
130
-
131
-
132
-
133
-
134
-
135
-
136
-
137
-
138
-
139
-
140
-
141
-
142
-
143
-
144
-
145
-
146
-
147
-
148
-
149
-
150
-
151
-
152
-
153
-
154
-
155
-
156
-
157
-
158
-
159
-
160
-
161
-
162
-
163
-
164
-
165
-
166
-
167
-
168
-
169
-
170
-
171
-
172
-
173
-
174
-
175
-
176
-
177
-
178
-
179
-
180
-
181
-
182
-
183
-
184
-
185
-
186
-
 187
187 -
 188
188 -
 189
189 -
 190
190 -
 191
191 -
 192
192 -
 193
193 -
 194
194 -
 195
195 -
 196
196 -
 197
197 -
 198
198 -
 199
199 -
 200
200 -
 201
201 -
 202
202 -
 203
203 -
 204
204 -
 205
205 -
 206
206 -
 207
207 -
208
-
209
-
210
-
211
-
212
-
213
-
214
-
215
-
216
-
217
-
218
-
219
-
220
-
221
-
222
-
223
-
224
-
225
-
226
-
227
-
228
-
229
-
230
-
231
-
232
-
233
-
234
-
235
-
236
-
237
-
238
-
239
-
240
-
241
-
242
-
243
-
244
-
245
-
246
-
247
-
248
-
249
-
250
-
251
-
252
-
253
-
254
-
255
-
256
-
257
-
258
-
259
-
260
-
261
-
262
-
263
-
264
-
265
-
266
-
267
-
268
-
269
-
270
-
271
-
272
-
273
-
274
-
275
-
276
-
277
-
278
-
279
-
280
-
281
-
282
-
283
-
284
-
285
-
286
-
287
-
288
-
289
-
290
-
291
-
292
-
293
-
294
-
295
-
296
-
297
-
298
-
299
-
300
-
301
-
302
-
303
-
304
-
305
-
306
-
307
-
308
 |
 |

177
PART II
DUKE ENERGY CORPORATION • DUKE ENERGY CAROLINAS, LLC • PROGRESS ENERGY, INC. • CAROLINA POWER & LIGHT COMPANY d/b/a PROGRESS ENERGY
CAROLINAS, INC. • FLORIDA POWER CORPORATION d/b/a PROGRESS ENERY FLORIDA, INC. • DUKE ENERGY OHIO, INC. • DUKE ENERGY INDIANA, INC
.
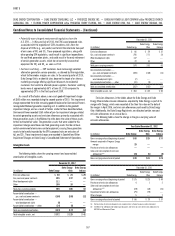
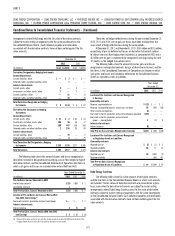
Combined Notes to Consolidated Financial Statements – (Continued)
December 31,
2012
December 31,
2011
(in millions) Asset Liability Asset Liability
Derivatives Designated as Hedging Instruments
Commodity contracts
Current liabilities: other $— $ 1 $— $ 2
Deferred credits and other liabilities: other ——— 1
Interest rate contracts
Deferred credits and other liabilities: other ——— 8
Total Derivatives Designated as Hedging Instruments $— $ 1 $ — $ 11
Derivatives Not Designated as Hedging Instruments
Commodity contracts(a)
Current Assets: Other $ 2 $— $— $ —
Investments and Other Assets: Other 7 — ——
Current liabilities: other — 146 5 266
Deferred credits and other liabilities: other — 123 — 222
Total Derivatives Not Designated as Hedging
Instruments $ 9 $269 $ 5 $488
Total Derivatives $ 9 $270 $ 5 $499
(a) Substantially all of these contracts receive regulatory treatment.
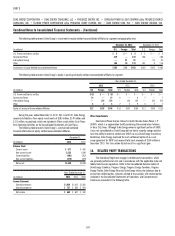
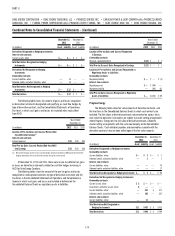
The following table shows the amount of gains and losses recognized
on derivative instruments designated and qualifying as cash fl ow hedges by
type of derivative contract, and the Consolidated Statements of Operations and
Comprehensive Income line items in which such gains and losses are included
when reclassifi ed from AOCI.
Years Ended
December 31,
(in millions) 2012 2011 2010
Pre-tax Gains (Losses) Recorded in AOCI(a)
Commodity contracts $ 1 $ (3) $ —
Interest rate contracts(b) (2) (35) (11)
Total Pre-tax Gains (Losses) Recorded in AOCI $ (1) $(38) $(11)
Location of Pre-tax Gains and (Losses) Reclassifi ed
from AOCI into Earnings(a)
Interest rate contracts(b)
Interest expense $ (2) $ (1) $ —
Total Pre-tax Gains (Losses) Reclassifi ed from AOCI
into Earnings $ (2) $ (1) $ —
Location of Pre-tax Gains and (Losses) Reclassifi ed from AOCI
to Regulatory Assets(c)
Interest rate contracts
Regulatory assets $(42) $— $—
Total Pre-tax Gains (Losses) Reclassifi ed from AOCI
to Regulatory Assets $(42) $— $—
(a) Effective portion
(b) Amounts in AOCI related to terminated hedges are reclassifi ed to earnings as the interest expense is recorded.
The effective portion of the hedges will be amortized to interest expense over the term of the related debt.
(c) To conform to Duke Energy policies, effective with the merger, Progress Energy no longer designates
derivative instruments related to interest rate cash fl ow hedges for regulated operations as cash fl ow
hedges. As a result, the pre-tax losses on open derivative contracts as of the date of the merger were
reclassifi ed from AOCI to Regulatory assets.
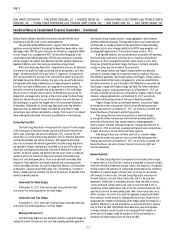
At December 31, 2011, $41 million of pre-tax deferred net losses on
derivative instruments related to interest rate cash fl ow hedges were included
as a component of AOCI.
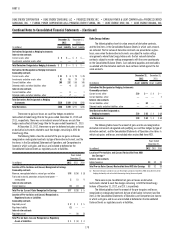
The following tables show the amount of pre-tax gains and losses
recognized on undesignated contracts by type of derivative instrument and the
line items in the Consolidated Statements of Operations and Comprehensive
Income in which such gains and losses are included or deferred on the
Consolidated Balance Sheets as regulatory assets or liabilities.
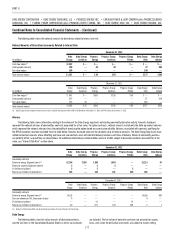
Year Ended
December 31,
(in millions) 2012 2011 2010
Location of Pre-tax Gains and (Losses) Recognized in
Earnings
Commodity contracts
Fuel used in electric generation and purchased power —
regulated(a) $(339) $(237) $(278)
Interest rate contracts
Interest expense (2) ——
Total Pre-tax (Losses) Gains Recognized in Earnings $(341) $(237) $(278)
Location of Pre-tax Gains and (Losses) Recognized as
Regulatory Assets or Liabilities
Commodity contracts(b)
Regulatory asset $(116) $(362) $(321)
Total Pre-tax Gains (Losses) Recognized as Regulatory
Assets of Liabilities $
(116) $(362) $(321)
(a) After settlement of the derivatives and the fuel is consumed, gains or losses are passed through the fuel
cost-recovery clause.
(b) Amounts are recorded in regulatory assets and liabilities in the Balance Sheets until derivatives are
settled.
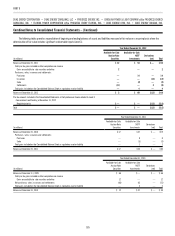
Duke Energy Ohio
The following tables show fair value amounts of derivative contracts,
and the line items in the Consolidated Balance Sheets in which such amounts
are included. The fair values of derivative contracts are presented on a gross
basis, even when the derivative instruments are subject to master netting
arrangements where Duke Energy Ohio nets the fair value of derivative
contracts subject to master netting arrangements with the same counterparty
on the Consolidated Balance Sheets. Cash collateral payables and receivables
associated with the derivative contracts have not been netted against the fair
value amounts.