Duke Energy 2012 Annual Report Download - page 131
Download and view the complete annual report
Please find page 131 of the 2012 Duke Energy annual report below. You can navigate through the pages in the report by either clicking on the pages listed below, or by using the keyword search tool below to find specific information within the annual report.-
 1
1 -
2
-
3
-
4
-
5
-
6
-
7
-
8
-
9
-
10
-
11
-
12
-
13
-
14
-
15
-
16
-
17
-
18
-
19
-
20
-
21
-
22
-
23
-
24
-
25
-
26
-
27
-
28
-
29
-
30
-
31
-
32
-
33
-
34
-
35
-
36
-
37
-
38
-
39
-
40
-
41
-
42
-
43
-
44
-
45
-
46
-
47
-
48
-
49
-
50
-
51
-
52
-
53
-
54
-
55
-
56
-
57
-
58
-
59
-
60
-
61
-
62
-
63
-
64
-
65
-
66
-
67
-
68
-
69
-
70
-
71
-
72
-
73
-
74
-
75
-
76
-
77
-
78
-
79
-
80
-
81
-
82
-
83
-
84
-
85
-
86
-
87
-
88
-
89
-
90
-
91
-
92
-
93
-
94
-
95
-
96
-
97
-
98
-
99
-
100
-
101
-
102
-
103
-
104
-
105
-
106
-
107
-
108
-
109
-
110
-
111
-
112
-
113
-
114
-
115
-
116
-
117
-
118
-
119
-
120
-
 121
121 -
 122
122 -
 123
123 -
 124
124 -
 125
125 -
 126
126 -
 127
127 -
 128
128 -
 129
129 -
 130
130 -
 131
131 -
 132
132 -
 133
133 -
 134
134 -
 135
135 -
 136
136 -
 137
137 -
 138
138 -
 139
139 -
 140
140 -
 141
141 -
142
-
143
-
144
-
145
-
146
-
147
-
148
-
149
-
150
-
151
-
152
-
153
-
154
-
155
-
156
-
157
-
158
-
159
-
160
-
161
-
162
-
163
-
164
-
165
-
166
-
167
-
168
-
169
-
170
-
171
-
172
-
173
-
174
-
175
-
176
-
177
-
178
-
179
-
180
-
181
-
182
-
183
-
184
-
185
-
186
-
187
-
188
-
189
-
190
-
191
-
192
-
193
-
194
-
195
-
196
-
197
-
198
-
199
-
200
-
201
-
202
-
203
-
204
-
205
-
206
-
207
-
208
-
209
-
210
-
211
-
212
-
213
-
214
-
215
-
216
-
217
-
218
-
219
-
220
-
221
-
222
-
223
-
224
-
225
-
226
-
227
-
228
-
229
-
230
-
231
-
232
-
233
-
234
-
235
-
236
-
237
-
238
-
239
-
240
-
241
-
242
-
243
-
244
-
245
-
246
-
247
-
248
-
249
-
250
-
251
-
252
-
253
-
254
-
255
-
256
-
257
-
258
-
259
-
260
-
261
-
262
-
263
-
264
-
265
-
266
-
267
-
268
-
269
-
270
-
271
-
272
-
273
-
274
-
275
-
276
-
277
-
278
-
279
-
280
-
281
-
282
-
283
-
284
-
285
-
286
-
287
-
288
-
289
-
290
-
291
-
292
-
293
-
294
-
295
-
296
-
297
-
298
-
299
-
300
-
301
-
302
-
303
-
304
-
305
-
306
-
307
-
308
 |
 |

111
PART II
Combined Notes to Consolidated Financial Statements – (Continued)
DUKE ENERGY CORPORATION • DUKE ENERGY CAROLINAS, LLC • PROGRESS ENERGY, INC. • CAROLINA POWER & LIGHT COMPANY d/b/a PROGRESS ENERGY
CAROLINAS, INC. • FLORIDA POWER CORPORATION d/b/a PROGRESS ENERY FLORIDA, INC. • DUKE ENERGY OHIO, INC. • DUKE ENERGY INDIANA, INC.
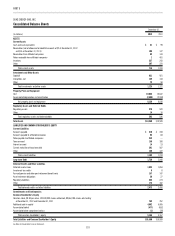
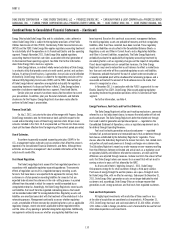
Restricted Cash.
The Duke Energy Registrants have restricted cash related primarily to
collateral assets, escrow deposits, and restricted cash of VIEs. Restricted
cash balances are refl ected in Other within Current Assets and in Other within
Investments and Other Assets on the Consolidated Balance Sheets.
December 31,
(in millions) 2012 2011
Duke Energy $574 $ 104
Duke Energy Carolinas — —
Progress Energy 11 35
Progress Energy Carolinas — —
Progress Energy Florida — —
Duke Energy Ohio — 30
Duke Energy Indiana — —
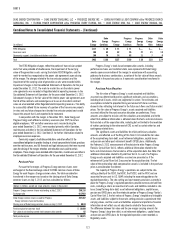
Inventory.
Inventory is comprised of amounts presented in the tables below and
is recorded primarily using the average cost method. Inventory related to the
Duke Energy Registrants’ regulated operations is valued at historical cost
consistent with ratemaking treatment. Materials and supplies are recorded as
inventory when purchased and subsequently charged to expense or capitalized
to property, plant and equipment when installed. Reserves are established for
excess and obsolete inventory. Inventory related to the Duke Energy Registrants’
nonregulated operations is valued at the lower of cost or market. The following
tables present the Duke Energy Registrants’ inventory.
December 31, 2012
(in millions)
Duke
Energy
Duke
Energy
Carolinas
Progress
Energy
Progress
Energy
Carolinas
Progress
Energy
Florida
Duke
Energy
Ohio
Duke
Energy
Indiana
Materials and supplies $1,751 $ 574 $ 768 $499 $269 $ 142 $ 164
Coal held for electric generation 1,468 488 673 329 344 82 216
Natural gas 4 — — — — 3 —
Total inventory $3,223 $1,062 $1,441 $828 $613 $ 227 $ 380
December 31, 2011
(in millions)
Duke
Energy
Duke
Energy
Carolinas
Progress
Energy
Progress
Energy
Carolinas
Progress
Energy
Florida
Duke
Energy
Ohio
Duke
Energy
Indiana
Materials and supplies $ 873 $ 505 $ 747 $446 $301 $ 150 $ 134
Coal held for electric generation 712 412 681 323 358 90 196
Natural gas 3 — 1 1 — 3 —
Total inventory $1,588 $ 917 $1,429 $770 $659 $ 243 $ 330
Duke Energy Ohio has agreements with a third party through which title
of natural gas inventory purchased by Duke Energy Ohio is transferred to a third
party. Under the agreements, the gas inventory is stored and managed for Duke
Energy Ohio and is delivered on demand. As a result of the agreements, the
combined natural gas inventory of approximately $44 million and $50 million
being held by a third party as of December 31, 2012, and December 31, 2011,
respectively, was classifi ed as Other within Current Assets on the Consolidated
Balance Sheets.
Investments in Debt and Equity Securities.
The Duke Energy Registrants classify investments into two categories —
trading and available-for-sale. Trading securities are reported at fair value in the
Consolidated Balance Sheets with net realized and unrealized gains and losses
included in earnings each period. Available-for-sale securities are also reported
at fair value on the Consolidated Balance Sheets with unrealized gains and losses
included in Accumulated Other Comprehensive Income (AOCI) or as a regulatory
asset or liability, unless it is determined that the carrying value of an investment
is other-than-temporarily impaired. Other-than-temporary impairments related
to equity securities and the credit loss portion of debt securities are included in
earnings, unless deferred in accordance with regulatory accounting treatment.
Investments in debt and equity securities are classifi ed as either short-term
investments or long-term investments based on management’s intent and ability
to sell these securities, taking into consideration illiquidity factors in the current
markets with respect to certain investments that have historically provided for a
high degree of liquidity, such as investments in auction rate debt securities.
See Note 17 for further information on the investments in debt and equity
securities, including investments held in the nuclear decommissioning trust
funds (NDTF).
Goodwill.
Duke Energy and Duke Energy Ohio perform annual goodwill impairment
tests as of August 31 each year and update these tests between annual tests if
events or circumstances occur that would more likely than not reduce the fair
value of a reporting unit below its carrying value.
In 2012, Progress Energy changed its goodwill impairment testing
date from October 31 to August 31. The change in the goodwill impairment
test date is preferable as it better aligns the annual goodwill impairment
testing procedures with the testing procedures of Duke Energy. The change
in accounting principle did not accelerate, delay, avoid, or cause a goodwill
impairment charge. Neither the change in the goodwill impairment testing