Duke Energy 2012 Annual Report Download - page 8
Download and view the complete annual report
Please find page 8 of the 2012 Duke Energy annual report below. You can navigate through the pages in the report by either clicking on the pages listed below, or by using the keyword search tool below to find specific information within the annual report.-
 1
1 -
 2
2 -
 3
3 -
 4
4 -
 5
5 -
 6
6 -
 7
7 -
 8
8 -
 9
9 -
 10
10 -
 11
11 -
 12
12 -
 13
13 -
 14
14 -
 15
15 -
 16
16 -
 17
17 -
 18
18 -
 19
19 -
20
-
21
-
22
-
23
-
24
-
25
-
26
-
27
-
28
-
29
-
30
-
31
-
32
-
33
-
34
-
35
-
36
-
37
-
38
-
39
-
40
-
41
-
42
-
43
-
44
-
45
-
46
-
47
-
48
-
49
-
50
-
51
-
52
-
53
-
54
-
55
-
56
-
57
-
58
-
59
-
60
-
61
-
62
-
63
-
64
-
65
-
66
-
67
-
68
-
69
-
70
-
71
-
72
-
73
-
74
-
75
-
76
-
77
-
78
-
79
-
80
-
81
-
82
-
83
-
84
-
85
-
86
-
87
-
88
-
89
-
90
-
91
-
92
-
93
-
94
-
95
-
96
-
97
-
98
-
99
-
100
-
101
-
102
-
103
-
104
-
105
-
106
-
107
-
108
-
109
-
110
-
111
-
112
-
113
-
114
-
115
-
116
-
117
-
118
-
119
-
120
-
121
-
122
-
123
-
124
-
125
-
126
-
127
-
128
-
129
-
130
-
131
-
132
-
133
-
134
-
135
-
136
-
137
-
138
-
139
-
140
-
141
-
142
-
143
-
144
-
145
-
146
-
147
-
148
-
149
-
150
-
151
-
152
-
153
-
154
-
155
-
156
-
157
-
158
-
159
-
160
-
161
-
162
-
163
-
164
-
165
-
166
-
167
-
168
-
169
-
170
-
171
-
172
-
173
-
174
-
175
-
176
-
177
-
178
-
179
-
180
-
181
-
182
-
183
-
184
-
185
-
186
-
187
-
188
-
189
-
190
-
191
-
192
-
193
-
194
-
195
-
196
-
197
-
198
-
199
-
200
-
201
-
202
-
203
-
204
-
205
-
206
-
207
-
208
-
209
-
210
-
211
-
212
-
213
-
214
-
215
-
216
-
217
-
218
-
219
-
220
-
221
-
222
-
223
-
224
-
225
-
226
-
227
-
228
-
229
-
230
-
231
-
232
-
233
-
234
-
235
-
236
-
237
-
238
-
239
-
240
-
241
-
242
-
243
-
244
-
245
-
246
-
247
-
248
-
249
-
250
-
251
-
252
-
253
-
254
-
255
-
256
-
257
-
258
-
259
-
260
-
261
-
262
-
263
-
264
-
265
-
266
-
267
-
268
-
269
-
270
-
271
-
272
-
273
-
274
-
275
-
276
-
277
-
278
-
279
-
280
-
281
-
282
-
283
-
284
-
285
-
286
-
287
-
288
-
289
-
290
-
291
-
292
-
293
-
294
-
295
-
296
-
297
-
298
-
299
-
300
-
301
-
302
-
303
-
304
-
305
-
306
-
307
-
308
 |
 |

work sites. We listened and invariably came away
inspired by our workforce.
More than 1,100 employees have left, or are in
the process of leaving, the company through the
Voluntary Severance Program as we have begun
to achieve efficiencies with the merger.
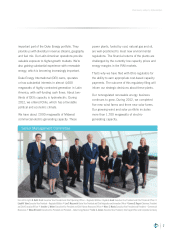
Going forward, we continue to strengthen our
performance culture. It is guided by our values: safety,
integrity, accountability, respect, communication,
inclusion and teamwork. The true test is how our
behaviors demonstrate these values every day.
Now that Duke Energy is the largest U.S. electric
utility, we’re able to offer even broader career
opportunities. We are attracting the next generation
of talented, diverse employees. Our employees
will help us improve, adapt and innovate for the
challenges of the future.
Delivering performance and value
Today’s Duke Energy has a unique blend of strengths.
Our post-merger company has greater scale
efficiencies and geographic diversity as well as a
more balanced, diversified power generation portfolio
that continues to get cleaner and more efficient.
The recent merger shifted Duke Energy’s business
mix toward a lower-risk regulated utility focus. We
now have six regulated electric utilities and two
regulated natural gas utilities.
Combined, our regulated utility operations represent
85 to 90 percent of our total business. The six
states we serve – North Carolina, South Carolina,
Florida, Indiana, Ohio and Kentucky – have
attractive economic-development prospects.
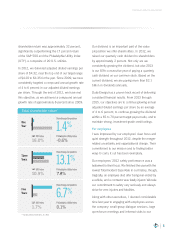
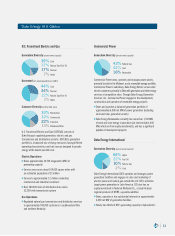
We have a balanced, diversified mix of fuel sources.
In 2012, 44 percent of our combined regulated
generation came from coal, 34 percent from
nuclear, 21 percent from natural gas (and some oil)
and 1 percent from hydro. That means 35 percent
of our power came from carbon-free sources.
As part of a $9 billion generation fleet modernization
program, we brought three state-of-the-art power
plants (two fueled by natural gas; one by coal) into
service in late 2012. Two more new plants (one
natural gas; one coal) come on line in 2013. By
the end of this year, we will have retired 3,800
megawatts of older coal- and large oil-fired units,
and that number will grow to approximately 6,800
megawatts over the next few years.
Also, Duke Energy and Progress Energy have
invested approximately $7.5 billion in air emissions
controls on existing plants since 1999. By 2015, we
expect the regulated fleet’s emissions of sulfur dioxide
and nitrogen oxides to be reduced by approximately
90 and 80 percent, respectively, from 2005 levels.
Beyond the regulated utility sector, our commercial
and international energy businesses remain an
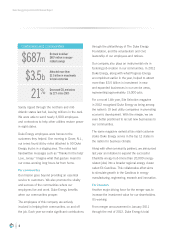
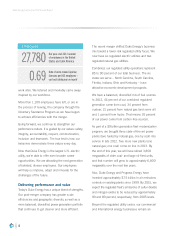
Employees
27,780
Our year-end 2012 number
of employees in the United
States and Latin America.
0.69
Rate of work-related injuries/
illnesses per 100 employees –
our best safety year on record.
Duke Energy Corporation 2012 Annual Report
6