Duke Energy 2012 Annual Report Download - page 108
Download and view the complete annual report
Please find page 108 of the 2012 Duke Energy annual report below. You can navigate through the pages in the report by either clicking on the pages listed below, or by using the keyword search tool below to find specific information within the annual report.-
 1
1 -
2
-
3
-
4
-
5
-
6
-
7
-
8
-
9
-
10
-
11
-
12
-
13
-
14
-
15
-
16
-
17
-
18
-
19
-
20
-
21
-
22
-
23
-
24
-
25
-
26
-
27
-
28
-
29
-
30
-
31
-
32
-
33
-
34
-
35
-
36
-
37
-
38
-
39
-
40
-
41
-
42
-
43
-
44
-
45
-
46
-
47
-
48
-
49
-
50
-
51
-
52
-
53
-
54
-
55
-
56
-
57
-
58
-
59
-
60
-
61
-
62
-
63
-
64
-
65
-
66
-
67
-
68
-
69
-
70
-
71
-
72
-
73
-
74
-
75
-
76
-
77
-
78
-
79
-
80
-
81
-
82
-
83
-
84
-
85
-
86
-
87
-
88
-
89
-
90
-
91
-
92
-
93
-
94
-
95
-
96
-
97
-
 98
98 -
 99
99 -
 100
100 -
 101
101 -
 102
102 -
 103
103 -
 104
104 -
 105
105 -
 106
106 -
 107
107 -
 108
108 -
 109
109 -
 110
110 -
 111
111 -
 112
112 -
 113
113 -
 114
114 -
 115
115 -
 116
116 -
 117
117 -
 118
118 -
119
-
120
-
121
-
122
-
123
-
124
-
125
-
126
-
127
-
128
-
129
-
130
-
131
-
132
-
133
-
134
-
135
-
136
-
137
-
138
-
139
-
140
-
141
-
142
-
143
-
144
-
145
-
146
-
147
-
148
-
149
-
150
-
151
-
152
-
153
-
154
-
155
-
156
-
157
-
158
-
159
-
160
-
161
-
162
-
163
-
164
-
165
-
166
-
167
-
168
-
169
-
170
-
171
-
172
-
173
-
174
-
175
-
176
-
177
-
178
-
179
-
180
-
181
-
182
-
183
-
184
-
185
-
186
-
187
-
188
-
189
-
190
-
191
-
192
-
193
-
194
-
195
-
196
-
197
-
198
-
199
-
200
-
201
-
202
-
203
-
204
-
205
-
206
-
207
-
208
-
209
-
210
-
211
-
212
-
213
-
214
-
215
-
216
-
217
-
218
-
219
-
220
-
221
-
222
-
223
-
224
-
225
-
226
-
227
-
228
-
229
-
230
-
231
-
232
-
233
-
234
-
235
-
236
-
237
-
238
-
239
-
240
-
241
-
242
-
243
-
244
-
245
-
246
-
247
-
248
-
249
-
250
-
251
-
252
-
253
-
254
-
255
-
256
-
257
-
258
-
259
-
260
-
261
-
262
-
263
-
264
-
265
-
266
-
267
-
268
-
269
-
270
-
271
-
272
-
273
-
274
-
275
-
276
-
277
-
278
-
279
-
280
-
281
-
282
-
283
-
284
-
285
-
286
-
287
-
288
-
289
-
290
-
291
-
292
-
293
-
294
-
295
-
296
-
297
-
298
-
299
-
300
-
301
-
302
-
303
-
304
-
305
-
306
-
307
-
308
 |
 |

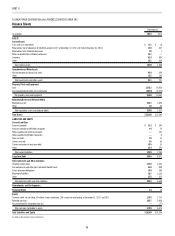
88
PART II
Accumulated Other
Comprehensive Income (Loss)
(in millions) Common Stock
Additional
Paid-in Capital
Unearned
ESOP
Common
Stock
Retained
Earnings
Net Gains
(Losses) on
Cash Flow
Hedges
Pension
and OPEB
Related
Adjustments
to AOCI
Common
Stockholders’
Equity
Noncontrolling
Interests
Total
Equity
Balance at December 31, 2009 $ 6,862 $ 11 $ (12) $ 2,675 $ (35) $ (52) $ 9,449 $ 6 $ 9,455
Cumulative effect of change in accounting
principle — — — — — — — (2) (2)
Net income(a) — — — 856 — — 856 3 859
Other comprehensive loss — — — — (28) (10) (38) — (38)
Common stock issuances, including dividend
reinvestment and employee benefi ts 461 — — — — — 461 — 461
Allocation of ESOP shares 9 — 12 — — — 21 — 21
Common stock dividends — — — (726) — — (726) — (726)
Distributions to noncontrolling interests — — — — — — — (2) (2)
Other — — — — — — — (1) (1)
Balance at December 31, 2010 $7,332 $ 11 $ — $ 2,805 $ (63) $ (62) $ 10,023 $ 4 $10,027
Net income(a) — — — 575 — — 575 3 578
Other comprehensive (loss) income — — — — (79) 39 (40) — (40)
Common stock issuances, including dividend
reinvestment and employee benefi ts 86 5 — — — — 91 — 91
Common stock dividends — — — (628) — — (628) — (628)
Distributions to noncontrolling interests — — — — — — — (3) (3)
Balance at December 31, 2011 $ 7,418 $ 16 $ — $ 2,752 $ (142) $ (23) $ 10,021 $ 4 $10,025
Net income(a) — — — 400 — — 400 3 403
Other comprehensive income (loss) — — — — 100 (2) 98 — 98
Common stock issuances, including dividend
reinvestment and employee benefi ts 18 13 — — — — 31 — 31
Common stock dividends — — — (369) — — (369) — (369)
Distributions to noncontrolling interests — — — — — — — (2) (2)
Recapitalization for merger with Duke Energy (7,436) 7,436 — — — — — — —
Other — — — — — — — (1) (1)
Balance at December 31, 2012 $ — $ 7,465 $ — $ 2,783 $ (42) $ (25) $ 10,181 $ 4 $10,185
(a) For the year ended December 31, 2012, consolidated net income of $407 million includes $4 million attributable to preferred shareholders of subsidiaries. For the year ended December 31, 2011, consolidated net income of
$582 million includes $4 million attributable to preferred shareholders of subsidiaries. For the year ended December 31, 2010, consolidated net income of $863 million includes $4 million attributable to preferred shareholders
of subsidiaries. Income attributable to preferred shareholders of subsidiaries is not a component of total equity and is excluded from the table above.
See Notes to Consolidated Financial Statements
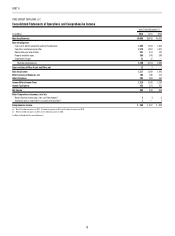
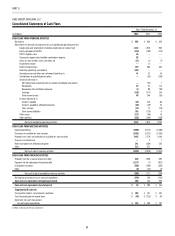
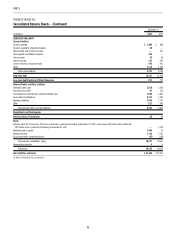
PROGRESS ENERGY, INC.
Consolidated Statements of Common Stockholder’s Equity