Duke Energy 2012 Annual Report Download - page 72
Download and view the complete annual report
Please find page 72 of the 2012 Duke Energy annual report below. You can navigate through the pages in the report by either clicking on the pages listed below, or by using the keyword search tool below to find specific information within the annual report.-
 1
1 -
2
-
3
-
4
-
5
-
6
-
7
-
8
-
9
-
10
-
11
-
12
-
13
-
14
-
15
-
16
-
17
-
18
-
19
-
20
-
21
-
22
-
23
-
24
-
25
-
26
-
27
-
28
-
29
-
30
-
31
-
32
-
33
-
34
-
35
-
36
-
37
-
38
-
39
-
40
-
41
-
42
-
43
-
44
-
45
-
46
-
47
-
48
-
49
-
50
-
51
-
52
-
53
-
54
-
55
-
56
-
57
-
58
-
59
-
60
-
61
-
 62
62 -
 63
63 -
 64
64 -
 65
65 -
 66
66 -
 67
67 -
 68
68 -
 69
69 -
 70
70 -
 71
71 -
 72
72 -
 73
73 -
 74
74 -
 75
75 -
 76
76 -
 77
77 -
 78
78 -
 79
79 -
 80
80 -
 81
81 -
 82
82 -
83
-
84
-
85
-
86
-
87
-
88
-
89
-
90
-
91
-
92
-
93
-
94
-
95
-
96
-
97
-
98
-
99
-
100
-
101
-
102
-
103
-
104
-
105
-
106
-
107
-
108
-
109
-
110
-
111
-
112
-
113
-
114
-
115
-
116
-
117
-
118
-
119
-
120
-
121
-
122
-
123
-
124
-
125
-
126
-
127
-
128
-
129
-
130
-
131
-
132
-
133
-
134
-
135
-
136
-
137
-
138
-
139
-
140
-
141
-
142
-
143
-
144
-
145
-
146
-
147
-
148
-
149
-
150
-
151
-
152
-
153
-
154
-
155
-
156
-
157
-
158
-
159
-
160
-
161
-
162
-
163
-
164
-
165
-
166
-
167
-
168
-
169
-
170
-
171
-
172
-
173
-
174
-
175
-
176
-
177
-
178
-
179
-
180
-
181
-
182
-
183
-
184
-
185
-
186
-
187
-
188
-
189
-
190
-
191
-
192
-
193
-
194
-
195
-
196
-
197
-
198
-
199
-
200
-
201
-
202
-
203
-
204
-
205
-
206
-
207
-
208
-
209
-
210
-
211
-
212
-
213
-
214
-
215
-
216
-
217
-
218
-
219
-
220
-
221
-
222
-
223
-
224
-
225
-
226
-
227
-
228
-
229
-
230
-
231
-
232
-
233
-
234
-
235
-
236
-
237
-
238
-
239
-
240
-
241
-
242
-
243
-
244
-
245
-
246
-
247
-
248
-
249
-
250
-
251
-
252
-
253
-
254
-
255
-
256
-
257
-
258
-
259
-
260
-
261
-
262
-
263
-
264
-
265
-
266
-
267
-
268
-
269
-
270
-
271
-
272
-
273
-
274
-
275
-
276
-
277
-
278
-
279
-
280
-
281
-
282
-
283
-
284
-
285
-
286
-
287
-
288
-
289
-
290
-
291
-
292
-
293
-
294
-
295
-
296
-
297
-
298
-
299
-
300
-
301
-
302
-
303
-
304
-
305
-
306
-
307
-
308
 |
 |

52
PART II
Goodwill Impairment Assessments
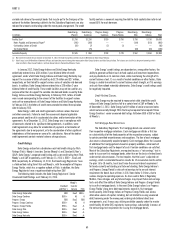
Duke Energy’s goodwill balances are included in the following table.
December 31,
(in millions) 2012 2011
U.S. Franchised Electric and Gas $15,950 $3,483
Commercial Power 62 69
International Energy 353 297
Total Duke Energy goodwill $16,365 $3,849
The Duke Energy allocates goodwill to a reporting unit, which Duke Energy
defi nes as an operating segment or one level below an operating segment.
During 2012, Duke Energy recorded $12,467 million of goodwill associated
with the merger with Progress Energy. This goodwill represents the excess of
the purchase price over the estimated fair values of the assets acquired and
liabilities assumed on the acquisition date, and was preliminarily allocated
entirely to the USFE&G segment. The goodwill recognized is subject to change
as additional information is obtained about the facts and circumstances that
existed as of the acquisition date. See Note 2, “Acquisitions and Sales of Other
Assets,” for additional information on the merger with Progress Energy.
The remainder of USFE&G’s goodwill relates to the acquisition of Cinergy
in April 2006. Commercial Power’s goodwill resulted from the 2008 acquisition
of Catamount Energy Corporation, a leading wind power company located in
Rutland, Vermont, and has been allocated to the Renewables reporting unit.
International Energy’s goodwill resulted from various acquisitions, including
$59 million from the 2012 acquisition of Iberoamericana de Energia Ibener S.A.
in Chile. See Note 2, “Acquisitions and Sales of Other Assets,” for additional
information.
Duke Energy recorded impairments of $500 million related to Commercial
Power’s nonregulated Midwest generation reporting unit in 2010. Subsequent
to the 2010 impairment charge there is no recorded amount of goodwill at
Commercial Power’s nonregulated Midwest generation reporting unit. These
impairment charges are recorded in Goodwill and Other Impairment Charges
on Duke Energy’s Consolidated Statement of Operations. See Note 12 to
the Consolidated Financial Statements, “Goodwill, Intangible Assets and
Impairments” for further information regarding the factors impacting the
valuation of Commercial Power’s nonregulated generation reporting unit. Duke
Energy determined that no other goodwill impairments existed in 2012, 2011,
and 2010.
As discussed in Note 12 to the Consolidated Financial Statements,
“Goodwill, Intangible Assets and Impairments,” Duke Energy is required to
test goodwill for impairment at the reporting unit level at least annually and
more frequently if events or circumstances occur that would more likely than
not reduce the fair value of a reporting unit below its carrying value. Duke
Energy evaluates the carrying amount of its recorded goodwill for impairment
on an annual basis as of August 31 and performs interim impairment tests if a
triggering event occurs that indicates it is more likely than not that the fair value
of a reporting unit is less than its carrying value.
The analysis of the potential impairment of goodwill may fi rst consider
qualitative factors to determine whether it is more likely than not (i.e., greater
than 50 percent chance) that the fair value of a reporting unit is less than its
book value. This is sometimes referred to as “step zero” and is an optional
step in the annual goodwill impairment analysis. If the results of qualitative
assessments indicate that the fair value of a reporting unit is more likely than
not less than the carrying value of the reporting unit, the two-step impairment
test is required. Step one of the impairment test involves comparing the fair
values of reporting units with their carrying values, including goodwill. If the
carrying amount is less than fair value in step one, further testing of goodwill is
not performed. If the carrying amount of a reporting unit exceeds the reporting
unit’s fair value, step two must be performed to determine the amount, if any, of
the goodwill impairment loss. Step two of the goodwill impairment test involves
comparing the implied fair value of the reporting unit’s goodwill against the
carrying value of the goodwill. Under step two, determining the implied fair value
of goodwill requires the valuation of a reporting unit’s identifi able tangible and
intangible assets and liabilities as if the reporting unit had been acquired in a
business combination on the testing date. The difference between the fair value
of the entire reporting unit as determined in step one and the net fair value of all
identifi able assets and liabilities represents the implied fair value of goodwill.
The goodwill impairment charge, if any, would be the difference between the
carrying amount of goodwill and the implied fair value of goodwill upon the
completion of step two.
As a result of the acquisition of Progress Energy, Duke Energy performed
step one of the goodwill impairment test as of August 31, 2012, and concluded
the fair value of each of its reporting units exceeded their respective carrying
values, and thus, did not record any impairment charges. In 2011, Duke Energy
performed the qualitative assessments under step zero and concluded that it was
more likely than not the fair value of each reporting unit exceeded its carrying
value. Thus, the two step goodwill impairment test was not necessary in 2011.
When performing step zero of the goodwill impairment test, Duke Energy’s
qualitative assessments include reviews of current forecasts compared to prior
forecasts, consideration of recent fair value calculations, if any, review of the
stock price performance of Duke Energy and its peers, credit ratings of Duke
Energy’s signifi cant subsidiaries, updates to weighted average cost of capital
(WACC) calculations or review of the key inputs to the WACC and consideration
of overall economic factors, recent regulatory commission actions and related
regulatory climates, and recent fi nancial performance.
For purposes of the step one analyses, determination of the reporting
units’ fair values is based on a combination of the income approach, which
estimates the fair value of Duke Energy’s reporting units based on discounted
future cash fl ows, and the market approach, which estimates the fair value of
Duke Energy’s reporting units based on market comparables within the utility
and energy industries. Generally, more emphasis is applied to the income
approach as it represents management’s best estimate of future value. Key
assumptions used in the income approach analyses include, but are not limited
to, estimated future cash fl ows and the use of an appropriate discount rate. The
market approach uses implied market multiples derived from comparable peer
utilities and market transactions to estimate the fair value.
Estimated future cash fl ows under the income approach are based to a
large extent on Duke Energy’s internal business plan, and adjusted as appropriate
for Duke Energy’s views of market participant assumptions. Duke Energy’s
internal business plan refl ects management’s assumptions related to customer
usage and attrition based on internal data and economic data obtained from
third -party sources, projected commodity pricing data and potential changes in
environmental regulations. The business plan assumes the occurrence of certain
events in the future, such as the outcome of future rate fi lings, future approved
rates of returns on equity, anticipated earnings/returns related to signifi cant
future capital investments, continued recovery of cost of service and the renewal
of certain contracts. Management also makes assumptions regarding the run rate
of operation, maintenance and general and administrative costs based on the
expected outcome of the aforementioned events. In estimating cash fl ows, Duke
Energy incorporates expected growth rates, regulatory and economic stability,
the ability to renew contracts and other factors, into its revenue and expense
forecasts. Should the actual outcome of some or all of these assumptions
differ signifi cantly from the current assumptions, revisions to current cash fl ow
assumptions could cause the fair value of Duke Energy’s reporting units to be
signifi cantly different in future periods.
One of the most signifi cant assumptions that Duke Energy utilizes in
determining the fair value of its reporting units under the income approach
is the discount rate applied to the estimated future cash fl ows. Management
determines the appropriate discount rate for each of its reporting units based
on the WACC for each individual reporting unit. The WACC takes into account
both the pre-tax cost of debt and cost of equity (a major component of the cost
of equity is the current risk-free rate on twenty year U.S. Treasury bonds). In the
2012 step one impairment tests, Duke Energy considered implied WACC’s for
certain peer companies in determining the appropriate WACC rates to use in its