Duke Energy 2012 Annual Report Download - page 16
Download and view the complete annual report
Please find page 16 of the 2012 Duke Energy annual report below. You can navigate through the pages in the report by either clicking on the pages listed below, or by using the keyword search tool below to find specific information within the annual report.-
 1
1 -
2
-
3
-
4
-
5
-
 6
6 -
 7
7 -
 8
8 -
 9
9 -
 10
10 -
 11
11 -
 12
12 -
 13
13 -
 14
14 -
 15
15 -
 16
16 -
 17
17 -
 18
18 -
 19
19 -
 20
20 -
 21
21 -
 22
22 -
 23
23 -
 24
24 -
 25
25 -
 26
26 -
27
-
28
-
29
-
30
-
31
-
32
-
33
-
34
-
35
-
36
-
37
-
38
-
39
-
40
-
41
-
42
-
43
-
44
-
45
-
46
-
47
-
48
-
49
-
50
-
51
-
52
-
53
-
54
-
55
-
56
-
57
-
58
-
59
-
60
-
61
-
62
-
63
-
64
-
65
-
66
-
67
-
68
-
69
-
70
-
71
-
72
-
73
-
74
-
75
-
76
-
77
-
78
-
79
-
80
-
81
-
82
-
83
-
84
-
85
-
86
-
87
-
88
-
89
-
90
-
91
-
92
-
93
-
94
-
95
-
96
-
97
-
98
-
99
-
100
-
101
-
102
-
103
-
104
-
105
-
106
-
107
-
108
-
109
-
110
-
111
-
112
-
113
-
114
-
115
-
116
-
117
-
118
-
119
-
120
-
121
-
122
-
123
-
124
-
125
-
126
-
127
-
128
-
129
-
130
-
131
-
132
-
133
-
134
-
135
-
136
-
137
-
138
-
139
-
140
-
141
-
142
-
143
-
144
-
145
-
146
-
147
-
148
-
149
-
150
-
151
-
152
-
153
-
154
-
155
-
156
-
157
-
158
-
159
-
160
-
161
-
162
-
163
-
164
-
165
-
166
-
167
-
168
-
169
-
170
-
171
-
172
-
173
-
174
-
175
-
176
-
177
-
178
-
179
-
180
-
181
-
182
-
183
-
184
-
185
-
186
-
187
-
188
-
189
-
190
-
191
-
192
-
193
-
194
-
195
-
196
-
197
-
198
-
199
-
200
-
201
-
202
-
203
-
204
-
205
-
206
-
207
-
208
-
209
-
210
-
211
-
212
-
213
-
214
-
215
-
216
-
217
-
218
-
219
-
220
-
221
-
222
-
223
-
224
-
225
-
226
-
227
-
228
-
229
-
230
-
231
-
232
-
233
-
234
-
235
-
236
-
237
-
238
-
239
-
240
-
241
-
242
-
243
-
244
-
245
-
246
-
247
-
248
-
249
-
250
-
251
-
252
-
253
-
254
-
255
-
256
-
257
-
258
-
259
-
260
-
261
-
262
-
263
-
264
-
265
-
266
-
267
-
268
-
269
-
270
-
271
-
272
-
273
-
274
-
275
-
276
-
277
-
278
-
279
-
280
-
281
-
282
-
283
-
284
-
285
-
286
-
287
-
288
-
289
-
290
-
291
-
292
-
293
-
294
-
295
-
296
-
297
-
298
-
299
-
300
-
301
-
302
-
303
-
304
-
305
-
306
-
307
-
308
 |
 |

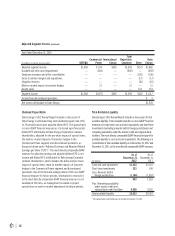
Adjusted Earnings and Adjusted Diluted Earnings
per Share (“EPS”)
Duke Energy’s 2012 Annual Report references 2012 adjusted
earnings of $2,483 million and adjusted diluted EPS of $4.32.
Adjusted earnings and adjusted diluted EPS is a non-GAAP
(generally accepted accounting principles) nancial measure as
it represents income from continuing operations after deducting
income attributable to noncontrolling interests, adjusted for the
dollar and per share impact of special items and the mark-to-market
impacts of economic hedges in the Commercial Power segment.
Special items represent certain charges and credits which
management believes will not be recurring on a regular basis,
although it is reasonably possible such charges and credits could
recur. Mark-to-market adjustments reect the mark-to-market
impact of derivative contracts, which is recognized in GAAP earnings
immediately as such derivative contracts do not qualify for hedge
accounting or regulatory accounting, used in Duke Energy’s hedging
of a portion of the economic value of certain of its generation assets
in the Commercial Power segment. The economic value of the
generation assets is subject to uctuations in the fair value due to
market price volatility of the input and output commodities (e.g.,
coal, power) and, as such, the economic hedging involves both
purchase and sales of those input and output commodities related
to the generation assets. Because the operations of the generation
assets are accounted for under the accrual method, management
believes that excluding the impact of mark-to-market changes of
the economic hedge contracts from adjusted earnings until
settlement better matches the nancial impacts of the hedge
contract with the portion of the economic value of the underlying
hedged asset. Management believes that the presentation of
adjusted earnings and adjusted diluted EPS provides an additional
relevant comparison of the company’s performance across
periods. Adjusted earnings and adjusted diluted EPS is also used
as a basis for employee incentive bonuses.
The most directly comparable GAAP measure for adjusted earnings
and adjusted diluted EPS is net income and diluted EPS attributable
to Duke Energy Corporation common shareholders, which includes
the dollar and per share impact of special items, the mark-to-market
impacts of economic hedges in the Commercial Power segment and
discontinued operations. The following is a reconciliation of net
income and diluted EPS to adjusted earnings and adjusted diluted
EPS for 2012, 2011 and 2010:
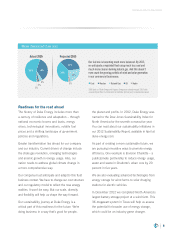
Duke Energy’s 2012 Annual Report also references Duke Energy’s
forecasted 2013 adjusted diluted EPS outlook range of $4.20 to $4.45
per share, which is consistent with the 2013 employee incentive earnings
target. The materials also reference the long-term targeted range of
growth of 4 percent to 6 percent in adjusted diluted EPS (on a compound
annual growth rate (“CAGR”) basis). Due to the forward-looking nature
of this non-GAAP nancial measure for future periods, information to
reconcile it to the most directly comparable GAAP nancial measure is
not available at this time, as management is unable to project special
items or mark-to-market adjustments to future periods.
Year Ended December 31 2012 2011 2010
Per Per Per
Diluted Diluted Diluted
(In millions, except per-share amounts) Amount Share Amount Share Amount Share
Adjusted earnings $2,483 $4.32 $1,943 $4.38 $1,882 $4.29
Edwardsport charges (402) (0.70) (135) (0.30) — —
Costs to achieve mergers and acquisitions (397) (0.70) (51) (0.12) (17) (0.04)
Mark-to-market impact of economic hedges (6) (0.01) (1) (0.01) 21 0.04
Democratic National Convention Host Committee support (6) (0.01) — — — —
Employee severance and office consolidation 60 0.11 — — (105) (0.24)
Emission allowance impairment — — (51) (0.12) — —
Goodwill and other asset impairments — — — — (602) (1.37)
Litigation reserves — — — — (16) (0.04)
Assets sales — — — — 154 0.35
Income from discontinued operations 36 $0.06 1 — 3 0.01
Net income attributable to Duke Energy $1,768 $3.07 $1,706 $3.83 $1,320 $3.00
Non-GAAP Financial Measures
14