MetLife 2011 Annual Report Download - page 93
Download and view the complete annual report
Please find page 93 of the 2011 MetLife annual report below. You can navigate through the pages in the report by either clicking on the pages listed below, or by using the keyword search tool below to find specific information within the annual report.-
 1
1 -
2
-
3
-
4
-
5
-
6
-
7
-
8
-
9
-
10
-
11
-
12
-
13
-
14
-
15
-
16
-
17
-
18
-
19
-
20
-
21
-
22
-
23
-
24
-
25
-
26
-
27
-
28
-
29
-
30
-
31
-
32
-
33
-
34
-
35
-
36
-
37
-
38
-
39
-
40
-
41
-
42
-
43
-
44
-
45
-
46
-
47
-
48
-
49
-
50
-
51
-
52
-
53
-
54
-
55
-
56
-
57
-
58
-
59
-
60
-
61
-
62
-
63
-
64
-
65
-
66
-
67
-
68
-
69
-
70
-
71
-
72
-
73
-
74
-
75
-
76
-
77
-
78
-
79
-
80
-
81
-
82
-
 83
83 -
 84
84 -
 85
85 -
 86
86 -
 87
87 -
 88
88 -
 89
89 -
 90
90 -
 91
91 -
 92
92 -
 93
93 -
 94
94 -
 95
95 -
 96
96 -
 97
97 -
 98
98 -
 99
99 -
 100
100 -
 101
101 -
 102
102 -
 103
103 -
104
-
105
-
106
-
107
-
108
-
109
-
110
-
111
-
112
-
113
-
114
-
115
-
116
-
117
-
118
-
119
-
120
-
121
-
122
-
123
-
124
-
125
-
126
-
127
-
128
-
129
-
130
-
131
-
132
-
133
-
134
-
135
-
136
-
137
-
138
-
139
-
140
-
141
-
142
-
143
-
144
-
145
-
146
-
147
-
148
-
149
-
150
-
151
-
152
-
153
-
154
-
155
-
156
-
157
-
158
-
159
-
160
-
161
-
162
-
163
-
164
-
165
-
166
-
167
-
168
-
169
-
170
-
171
-
172
-
173
-
174
-
175
-
176
-
177
-
178
-
179
-
180
-
181
-
182
-
183
-
184
-
185
-
186
-
187
-
188
-
189
-
190
-
191
-
192
-
193
-
194
-
195
-
196
-
197
-
198
-
199
-
200
-
201
-
202
-
203
-
204
-
205
-
206
-
207
-
208
-
209
-
210
-
211
-
212
-
213
-
214
-
215
-
216
-
217
-
218
-
219
-
220
-
221
-
222
-
223
-
224
-
225
-
226
-
227
-
228
-
229
-
230
-
231
-
232
-
233
-
234
-
235
-
236
-
237
-
238
-
239
-
240
-
241
-
242
-
243
 |
 |

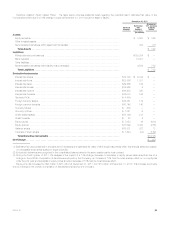
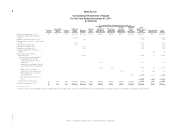
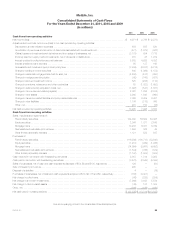
MetLife, Inc.
Consolidated Statements of Operations
For the Years Ended December 31, 2011, 2010 and 2009
(In millions, except per share data)
2011 2010 2009
Revenues
Premiums ..................................................................... $36,361 $ 27,071 $ 26,157
Universal life and investment-type product policy fees ................................... 7,806 6,028 5,197
Net investment income ........................................................... 19,606 17,511 14,741
Other revenues ................................................................. 2,532 2,328 2,329
Net investment gains (losses): ......................................................
Other-than-temporary impairments on fixed maturity securities ........................... (924) (682) (2,432)
Other-than-temporary impairments on fixed maturity securities transferred to other
comprehensive income (loss) .................................................. (31) 212 939
Other net investment gains (losses) ................................................ 88 62 (1,408)
Total net investment gains (losses) .............................................. (867) (408) (2,901)
Net derivative gains (losses) ...................................................... 4,824 (265) (4,866)
Total revenues ............................................................ 70,262 52,265 40,657
Expenses
Policyholder benefits and claims .................................................... 35,457 29,185 28,003
Interest credited to policyholder account balances ...................................... 5,603 4,919 4,845
Policyholder dividends ............................................................ 1,446 1,485 1,649
Other expenses ................................................................. 17,730 12,764 10,521
Total expenses ............................................................ 60,236 48,353 45,018
Income (loss) from continuing operations before provision for income tax ..................... 10,026 3,912 (4,361)
Provision for income tax expense (benefit) ............................................. 3,075 1,165 (2,025)
Income (loss) from continuing operations, net of income tax ............................... 6,951 2,747 (2,336)
Income (loss) from discontinued operations, net of income tax ............................. 20 39 58
Net income (loss) ................................................................ 6,971 2,786 (2,278)
Less: Net income (loss) attributable to noncontrolling interests ............................. (10) (4) (32)
Net income (loss) attributable to MetLife, Inc. .......................................... 6,981 2,790 (2,246)
Less: Preferred stock dividends .................................................... 122 122 122
Preferred stock redemption premium ............................................ 146 — —
Net income (loss) available to MetLife, Inc.’s common shareholders ......................... $ 6,713 $ 2,668 $ (2,368)
Income (loss) from continuing operations, net of income tax, available to MetLife, Inc.’s common
shareholders per common share:
Basic ....................................................................... $ 6.32 $ 2.98 $ (2.96)
Diluted ...................................................................... $ 6.27 $ 2.96 $ (2.96)
Net income (loss) available to MetLife, Inc.’s common shareholders per common share:
Basic ....................................................................... $ 6.34 $ 3.02 $ (2.89)
Diluted ...................................................................... $ 6.29 $ 3.00 $ (2.89)
Cash dividends declared per common share .......................................... $ 0.74 $ 0.74 $ 0.74
See accompanying notes to the consolidated financial statements.
MetLife, Inc. 89